Slide 4 of 10 from Corporate Annual Meeting PowerPoint Template
KPIs Dashboard Slide with Relevant Data Visualization
KPIs Dashboard for Corporate Annual Meeting
- Chart
- Dashboard Composite
- Kpi Reporting Slide
- 16:9
- 100% Editable
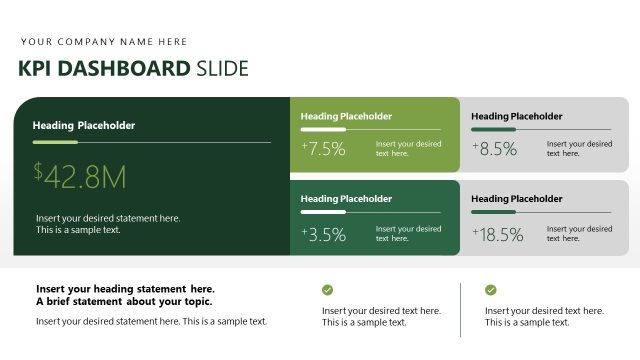
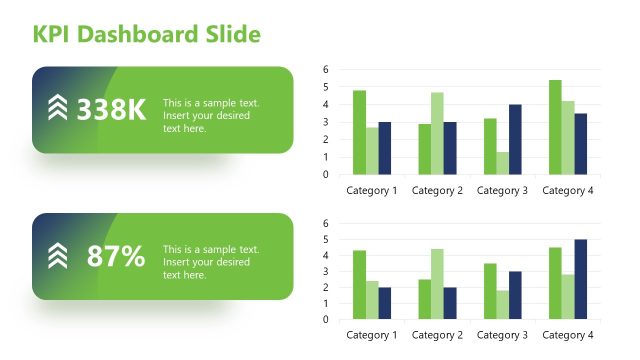
The KPIs Dashboard slide from the Corporate Annual Meeting PowerPoint Template provides a clear visual layout for tracking key performance indicators using editable slides with line and bar charts. This slide template supports business presentations by enabling concise quarterly or annual performance reviews through easily customizable charts and vector icons.
What’s on This Slide
The layout features a title at the top left, labeled 'KPIs Dashboard,' with a placeholder for additional text beneath it. On the left, a line chart displays data points for the years 2020 to 2024, with connecting lines and markers indicating trends. To the right, a horizontal bar chart presents four KPI values labeled V1 to V4, with corresponding percentage values below. Each chart is visually distinct, with a light background and contrasting colors. Text placeholders are positioned strategically to allow for clear readability.
How to Use It
This layout serves as a KPI dashboard, ideal for presenting key performance indicators in a corporate setting. It fits well after introductory slides, providing a visual summary of performance metrics. This structure is useful for quarterly reviews, annual reports, or strategic meetings where performance tracking is essential. It allows for quick comparisons and highlights trends effectively, making it suitable for stakeholders needing concise data representation.
Text Placeholders & Capacity
Keep your copy within these limits so it fits without resizing. Body slots can accommodate roughly 15 words each.
| Placeholder | Count | Max characters (approx.) |
|---|---|---|
| Slide title | 1 | 30 |
| Body paragraph | 1 | 100 |
| Item heading | 4 | 10 |
| Item body | 4 | 20 |
| Kpi value | 4 | 10 |
Slide Keywords
Download unlimited PowerPoint templates, charts and graphics for your presentations with our annual plan.
DOWNLOADReturn to Corporate Annual Meeting PowerPoint Template.