Slide 15 of 15 from Crowdfunding Campaign Plan PowerPoint Template
KPI Dashboard Slide – Crowdfunding Campaign Plan Slide PPT Template
KPI Dashboard for Crowdfunding Campaign
- Chart
- Dashboard Composite
- Kpi Reporting Slide
- 16:9
- 100% Editable
The KPI Dashboard slide from the Crowdfunding Campaign Plan PowerPoint Template offers a clear summary of campaign metrics using editable slides and vector icons. Designed for investor updates and team progress reviews, this slide integrates a line chart and key performance indicators to support effective business presentations and pitch deck templates.
What’s on This Slide
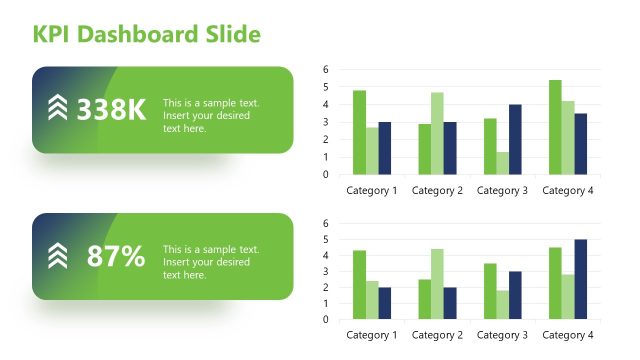
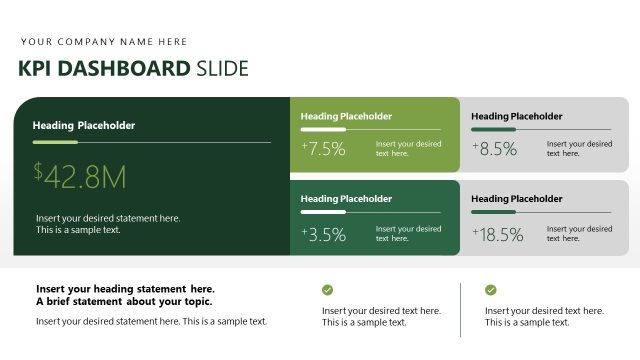
The slide features a dark background with a prominent title at the top left, labeled 'KPI Dashboard.' Below this, there are four key metrics displayed in a grid format: 'Total Funds Raised,' 'Total Backers,' 'Total Page Views,' and 'Time Remaining.' Each metric includes a numerical value and additional context. A line chart is positioned on the right, showcasing growth trends with multiple colored lines. An indicator box highlights '86% GROWTH.' Text placeholders are present for chart titles and descriptions, with a clear visual hierarchy emphasizing the metrics.
How to Use It
This layout serves as a KPI dashboard, summarizing key performance indicators for a crowdfunding campaign. It fits into the presentation as a concluding slide, providing a snapshot of campaign metrics. This structure is useful for stakeholders to quickly assess campaign performance, track progress, and make informed decisions. It is ideal for investor presentations, campaign updates, or team reviews, where concise data visualization is essential.
Text Placeholders & Capacity
Keep your copy within these limits so it fits without resizing. Node slots are moderate, roughly 4-6 words each.
| Placeholder | Count | Max characters (approx.) |
|---|---|---|
| Slide title | 1 | 30 |
| Item heading | 4 | 20 |
| Item body | 4 | 30 |
| Chart title | 1 | 30 |
| Kpi value | 4 | 10 |
| Kpi caption | 4 | 30 |
| Callout | 1 | 20 |
Slide Keywords
Download unlimited PowerPoint templates, charts and graphics for your presentations with our annual plan.
DOWNLOAD