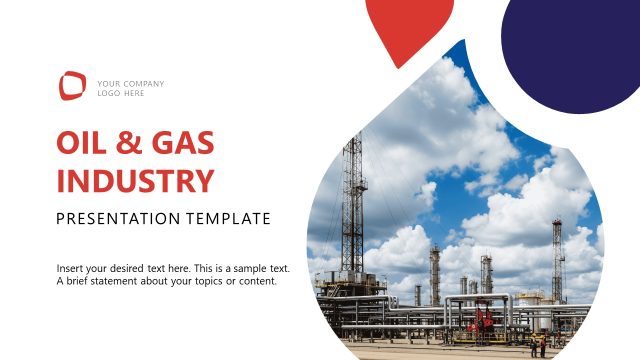
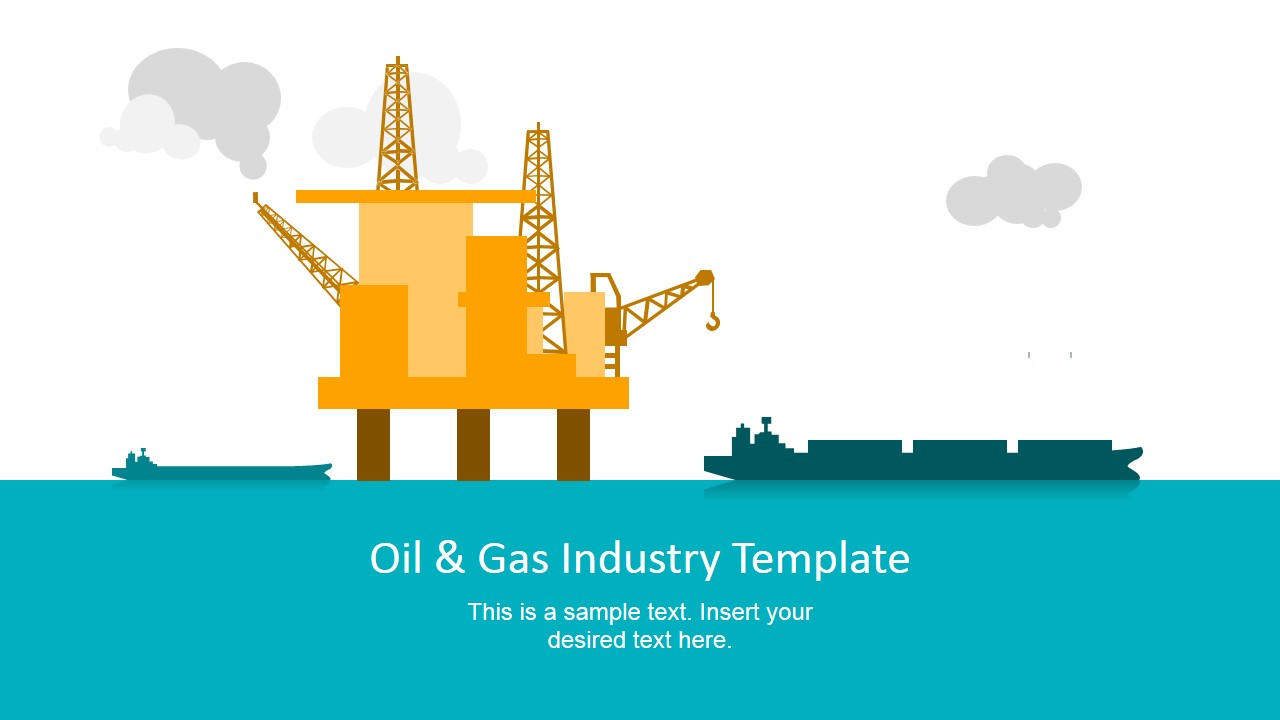
Oil & Gas Industry PowerPoint Template is a professional presentations which provides themed scenes for the Oil and Gas Industry. The template provides top of the line scene vectors of offshore drilling platform, oil transportation ships and a set of sixteen different clipart icons that the presenter can combine to create high quality visual presentations. Charts and flow diagrams with Oil & Gas themes are included allowing the user to create infographics about the Oil & Gas industry.
Crude oil and natural gas are naturally occurring substances present bellow surface, in rock amidst the earth’s crust. The origin of oil and gas is organic material compressed in sedimentary rock. As layers of sediment were deposited on the ocean floor, decaying remains of plants and animals were integrated into the forming rock. This organic material eventually transformed into oil and gas after being exposed to a specific temperature and pressure range deep within the earth’s crust. To extract the hydrocarbons from the sedimentary rock is necessary different drilling processes, which require extensive investments due to their complexity.
The Oil and Gas Industry includes several sub-categories as exploration, extraction and refining. Logistics play an important role in the overall industry environment through the transportation by oil tankers and pipelines. The oil and gas industry is divided in three major sectors, upstream, midstream and downstream. The upstream sector references the exploration and production (E&P). The midstream references transportation, storage and marketing of oil and gas productions. The downstream (generally unified with the midstream sector) focuses on the refining of crude oil and purification of natural gas.
Oil & Gas is the main raw material for many industries, and has become one of the most important supplies for maintenance of the modern civilization. Oil and Gas accounts for the largest percentage of the world energy generation, and the production , transportation, refining and commercialization of oil and gas has become the worlds biggest industry in money value.
The oil and gas industry not only is strongly regulated on every nation, its also one of the most traded markets in the stock and commodities derivatives markets, being their most influential indicators (West Texas price and Brent index) two of the most followed trading indicators in the world of markets.
Impress your audience creating high visual quality presentation with our modern and appealing Oil & Gas Industry PowerPoint Template.
What’s inside this template
Example presentation scenarios
- An energy consultant can use the upstream, midstream, and downstream quadrant panels to explain the oil and gas value chain to a client leadership team.
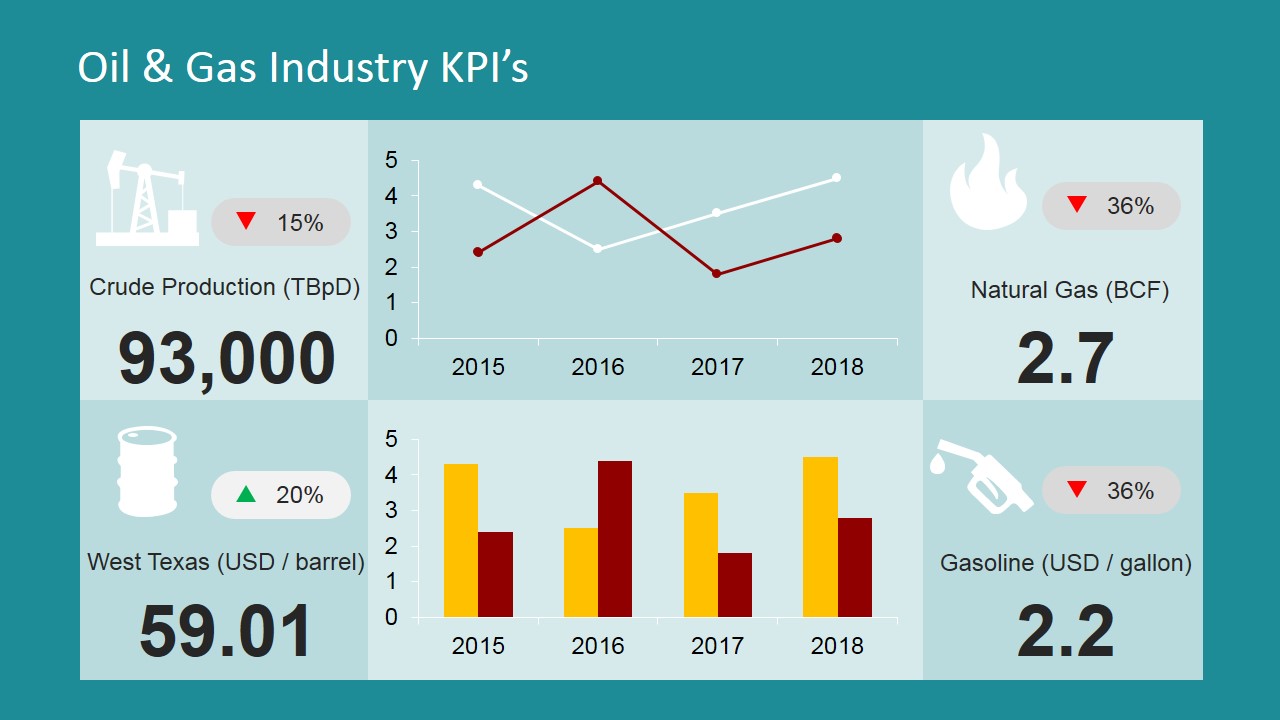
- An operations manager can present production, pricing, and fuel metrics with the KPI dashboard and charts during a monthly performance review.
- A logistics presenter can use the midstream panel, process flow diagram, tanker icons, and map locator to explain transportation and storage routes.
- A business development team can open with the offshore rig cover and circular icon hub to introduce capabilities in exploration, refining, and fuel distribution.
Features
- 100% editable presentation template
- Compatible with Microsoft PowerPoint and Google Slides
- 16:9 aspect ratio slides
- Scalable vector shapes, icons and illustrations
- AI-Ready for Microsoft Copilot and Claude
- Instant access and download
Frequently asked questions
Q: How should a presenter organize an oil and gas value chain story with this template?
A: Start with the offshore rig cover to orient the audience, then use the icon library to define core activities. Move into the upstream, midstream, and downstream panels as the main structure. Add the KPI dashboard after the sector overview so metrics feel connected to operations rather than presented as isolated numbers.
Q: Who is this template best suited for in a business presentation setting?
A: It fits consultants, operators, analysts, and business development teams explaining petroleum assets, logistics, or performance to a mixed audience. The layouts are useful when viewers need a quick visual bridge between technical activities such as drilling, shipping, refining, and storage, and business topics such as KPIs or market position.
Q: Why do the flat icons, rig scenes, and sector panels work well for this topic?
A: Oil and gas topics can become abstract quickly, especially when the discussion moves across exploration, transportation, refining, and pricing. The rig, tanker, barrel, valve, and refinery icons act as visual anchors. The colored quadrant panels create simple mental categories, helping audiences remember where each activity belongs in the value chain.




Oil & Gas Industry PowerPoint Template
10-slide presentation template for oil and gas KPIs, sector panels, and rig visuals
This is a 10-slide oil and gas industry presentation template for Microsoft PowerPoint and Google Slides. Visible layouts include offshore rig cover scenes, upstream/midstream/downstream sector panels, a KPI dashboard with line and bar charts, oil barrel comparison graphics, and a world map locator layout.
- Category
- Shapes
- Rating


 Loading...
- Aspect ratio
- 16:9, 4:3
- Item ID
- 6721-01
- Colors
 Microsoft PowerPoint
 Microsoft Copilot
 Claude for PowerPoint
Other formats supported
Subscribe today and get immediate
access to download our PowerPoint templates.