Slide 1 of 1 from Moat Infographic PowerPoint Template
Moat Infographic Presentation Slide Template
Moat Infographic Diagram for Competitive Advantage
- Diagram
- Other
- Strategic Analysis Slide
- 16:9
- 100% Editable
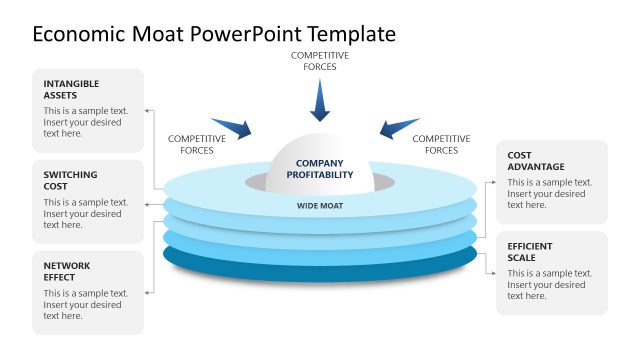
The Moat Infographic Diagram from the Moat Infographic PowerPoint Template offers a strategic analysis layout ideal for business presentations focused on competitive advantages. This slide template uses editable shapes and vector icons to visually represent key market factors such as intangible assets and cost advantage, enhancing clarity in corporate presentations and pitch decks.
What’s on This Slide
The layout features a central isometric castle illustration surrounded by a moat. Five circular icons are positioned around the castle, each representing key concepts: intangible assets, network effect, cost advantage, switching costs, and efficient scale. Text placeholders are located below each icon, aligned centrally, allowing for additional descriptions. The background is a deep blue, enhancing the visual contrast with the lighter blue castle and icons. The overall composition emphasizes the castle as the focal point, with icons evenly spaced to create balance.
How to Use It
This diagram serves to illustrate competitive advantages in a strategic context. It fits well in presentations discussing business strategies, market positioning, or economic factors. The layout can be used to highlight specific advantages of a product or service, making it suitable for strategists, consultants, or founders. It is effective in conveying complex ideas visually, allowing for quick comprehension of competitive elements.
Text Placeholders & Capacity
Keep your copy within these limits so it fits without resizing. Node labels can hold about 5 words each, while body text can accommodate roughly 10 words.
| Placeholder | Count | Max characters (approx.) |
|---|---|---|
| Item heading | 5 | 30 |
| Item body | 5 | 50 |
| Slide title | 1 | 50 |
Slide Keywords
Download unlimited PowerPoint templates, charts and graphics for your presentations with our annual plan.
DOWNLOADReturn to Moat Infographic PowerPoint Template.