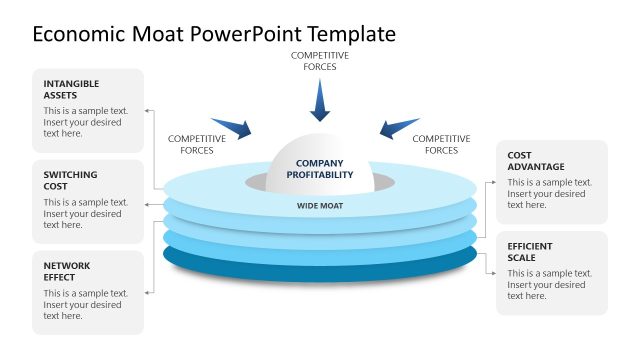
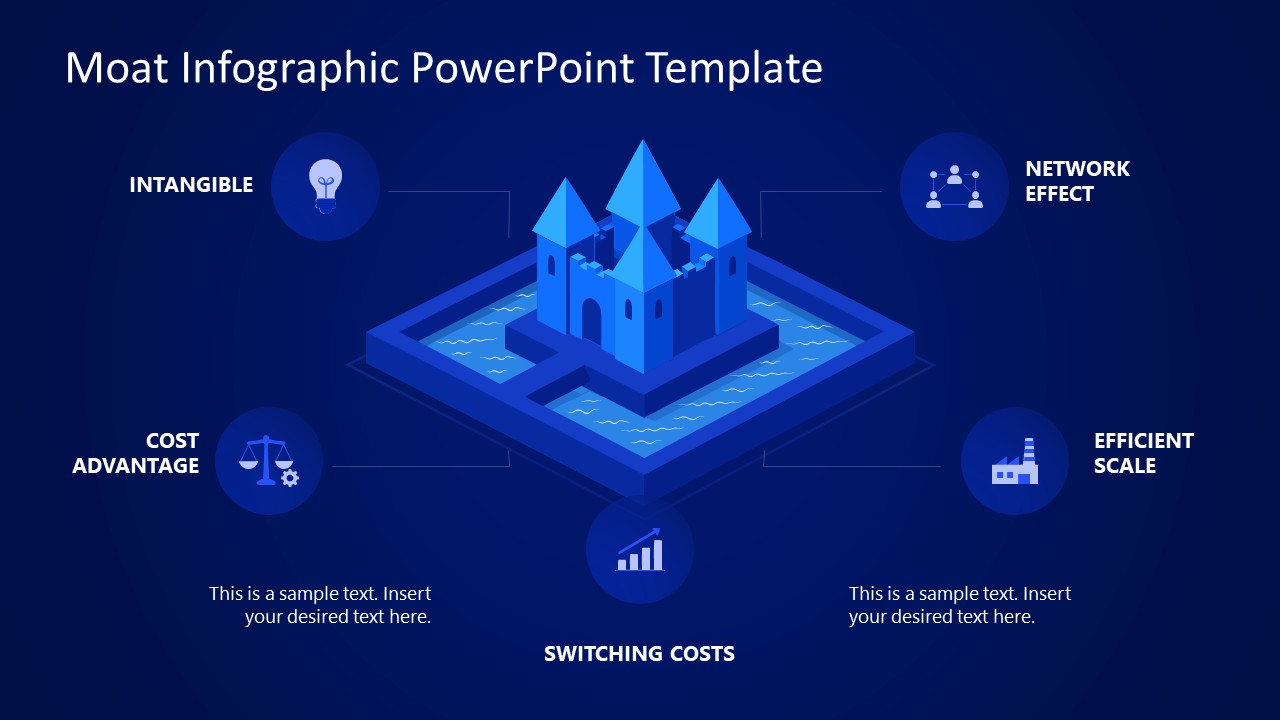
Customize the Moat Infographic PowerPoint Template to showcase the key components of a competitive advantage. This layout has an isometric design that is fully customizable for executive presentations and client meetings. The template features a 3D castle in the center of the slide on a blue background, surrounded by the moat. A moat refers to a deep, wide ditch dug around the castle or a building that protects it from enemies. In the business domain, moat is a unique business aspect or USP that gives the business a high competitive advantage. This means that a moat helps a business overcome its competitors. The PPT template shows a moat around the central 3D blue castle. Five infographic icons around the castle help strategy directors communicate five key points of competitive edge, which are:
- Intangible Assets
- Network Effect
- Cost Advantage
- Switching Costs
- Efficient Scale
The Moat Infographic PowerPoint Template is a single slide template with a dark blue layout. A startup founder uses the moat infographic template in Series B fundraisers to outline the real competition in the market. They can give an overview of their unique product that can beat competitors out there in the market. A corporate strategist uses the moat diagram to communicate the multiple weak areas where the department is lacking in competition. Management consultants in M&A analysis present the intangible assets and network effect categories to show where the actual business advantage lies during partnership meetings. Moreover, our users can also change the colors and shapes of the design to match their needs.
Download our moat infographic presentation template to clearly frame your company’s competitive defense capacity for investors and stakeholders.
What’s inside this template
Example presentation scenarios
- A startup founder can use the castle diagram during an investor pitch to explain why intangible assets, switching costs, or network effect make the company harder to copy.
- A corporate strategy director can use the five icon callouts in an executive workshop to compare the strongest and weakest sources of competitive protection.
- A management consultant can use the moat metaphor in a client meeting to summarize where cost advantage, efficient scale, or network effect supports an acquisition thesis.
- A business analyst can use the editable sample text areas to add short evidence statements beneath the moat diagram for a market share or profitability review.
Features
- 100% editable presentation template
- Compatible with Microsoft PowerPoint and Google Slides
- 16:9 aspect ratio slides
- Scalable vector shapes, icons and illustrations
- AI-Ready for Microsoft Copilot and Claude
- Instant access and download
Frequently asked questions
Q: How should a presenter explain the five moat factors without overloading the slide?
A: Start with the central claim: the business is protected by specific advantages. Then walk clockwise through the five callouts and give only one proof point for each. Keep the two body text areas for the strongest evidence or caveats, not long definitions, so the castle remains the visual anchor.
Q: When is this moat infographic a better choice than a competitor comparison table?
A: Use it when the audience already understands the market and needs a strategic view of defensibility. It is strongest for founders, consultants, and strategy leaders who want to explain why a business can protect margin, market share, or customer retention. A table is better for detailed competitor-by-competitor evidence.
Q: Why does the castle and moat metaphor help communicate competitive advantage?
A: The metaphor turns an abstract strategy concept into a concrete visual: the company is the castle and the surrounding moat represents defenses against competitors. The five icons distribute the explanation around that center, helping the presenter show that defensibility comes from multiple barriers rather than one isolated strength.
Moat Infographic PowerPoint Template
1-slide presentation template for competitive moat strategy with castle diagram and advantage icons
Moat Infographic PowerPoint Template is a 1-slide diagram for explaining competitive advantage. It centers an isometric castle and moat illustration with five icon callouts for intangible assets, network effect, cost advantage, switching costs, and efficient scale. Built for strategists, founders, and consultants, it supports Microsoft PowerPoint and Google Slides.
- Category
- Diagrams
- Rating

 Loading...
- Aspect ratio
- 16:9
- Item ID
- 23456-01
- Colors
 Microsoft PowerPoint
  Microsoft Copilot
  Claude for PowerPoint
 Other formats supported
Subscribe today and get immediate
access to download our PowerPoint templates.