Slide 1 of 1 from Economic Moat PowerPoint Template
Economic Moat Presentation Diagram Template
Economic Moat Diagram for Business Analysis
- Diagram
- Layered Stack
- Strategic Analysis Slide
- 16:9
- 100% Editable
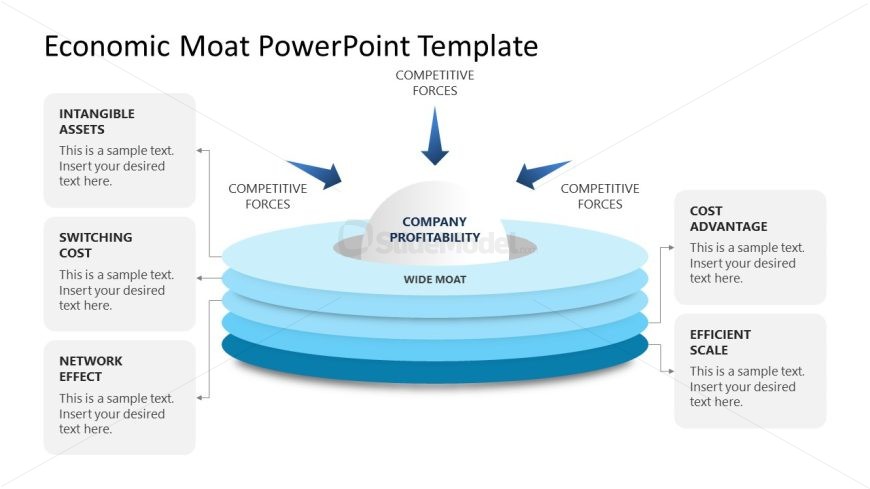
The Economic Moat Diagram slide from the Economic Moat PowerPoint Template visually breaks down key factors like intangible assets and cost advantage that shape company profitability. This slide template is ideal for business presentations focused on strategic analysis and competitive forces, providing editable shapes and clear visual hierarchy to support investment or corporate strategy discussions.
What’s on This Slide
The slide features a central circular shape labeled 'Company Profitability' surrounded by a wider circular layer labeled 'Wide Moat.' Four rectangular text placeholders are positioned at the corners, each labeled with a concept: 'Intangible Assets,' 'Switching Cost,' 'Cost Advantage,' and 'Efficient Scale.' Arrows labeled 'Competitive Forces' point towards the central circle from the top and sides. The overall color scheme includes shades of blue and gray, with a clear visual hierarchy emphasizing the central concept. The layout is structured to guide the viewer's focus inward.
How to Use It
This layout serves as a visual representation of the economic moat concept, illustrating how various factors contribute to a company's profitability. It is suitable for presentations discussing competitive advantages in business strategy. This slide fits well in a sequence following problem identification, leading into strategic recommendations. It can be used in contexts such as investment analysis, business planning, or competitive landscape assessments.
Text Placeholders & Capacity
Keep your copy within these limits so it fits without resizing. Node body slots can hold about 10 words each comfortably.
| Placeholder | Count | Max characters (approx.) |
|---|---|---|
| Item heading | 4 | 30 |
| Item body | 4 | 50 |
| Slide title | 1 | 40 |
Slide Keywords
Download unlimited PowerPoint templates, charts and graphics for your presentations with our annual plan.
DOWNLOADReturn to Economic Moat PowerPoint Template.