Slide 2 of 4 from Lightweight Store Performance Dashboard PowerPoint Template
Editable Lightweight Store Performance Dashboard PPT Template
Sales KPI Dashboard for Retail Performance
- Chart
- Dashboard Composite
- Evaluation Slide
- 16:9
- 100% Editable
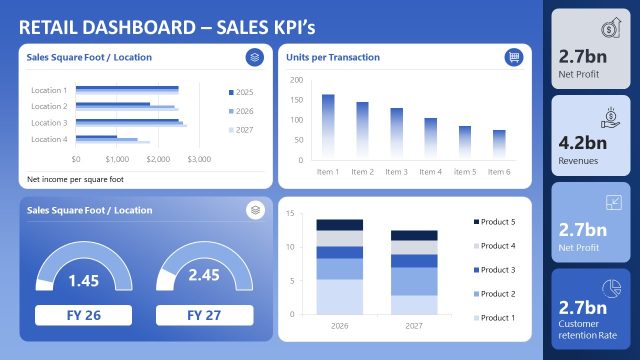
The Sales KPI Dashboard slide from the Lightweight Store Performance Dashboard PowerPoint Template offers a comprehensive layout with multiple charts and gauges ideal for business presentations focused on sales performance review. This slide template supports clear visualization of key performance indicators across locations and products, making it a practical choice for corporate presentations and pitch deck templates that require detailed KPI reporting with editable shapes and vector icons.
What’s on This Slide
The layout features multiple charts and data visualizations. On the top left, a horizontal bar chart displays sales per square foot for four locations, with years 2025 to 2027 represented by distinct colors. The top right contains a vertical bar chart showing units per transaction across six items. Below, two circular gauges indicate sales per square foot for fiscal years 2026 and 2027. A stacked bar chart shows product performance for 2026 and 2027. Text placeholders exist for titles and data labels, aligned to enhance visual hierarchy.
How to Use It
This layout serves as a performance dashboard, ideal for presenting sales KPIs in a retail context. It fits well after introductory slides that outline business objectives, providing a clear overview of key metrics. Use this structure to report on sales performance, compare locations, and analyze product trends. It is suitable for quarterly business reviews or strategic planning sessions, allowing stakeholders to visualize critical data effectively.
Text Placeholders & Capacity
Keep your copy within these limits so it fits without resizing. Node labels can accommodate roughly 6-8 words each.
| Placeholder | Count | Max characters (approx.) |
|---|---|---|
| Chart title | 1 | 30 |
| Item heading | 6 | 15 |
| Item body | 6 | 10 |
| Footer | 1 | 50 |
Slide Keywords
Download unlimited PowerPoint templates, charts and graphics for your presentations with our annual plan.
DOWNLOADReturn to Lightweight Store Performance Dashboard PowerPoint Template.