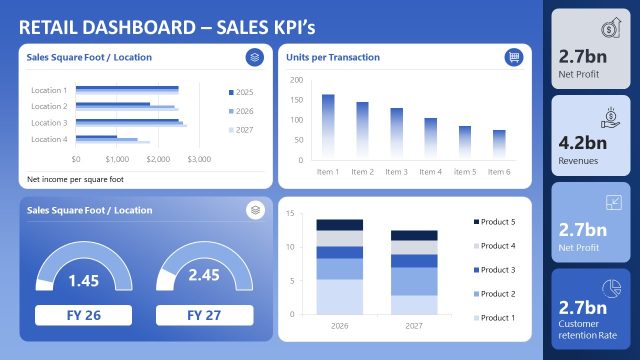
Slide 3 of 4 from Lightweight Store Performance Dashboard PowerPoint Template
Lightweight Store Performance Dashboard PPT Slide
Sales Performance Dashboard Overview
- Chart
- Dashboard Composite
- Evaluation Slide
- 16:9
- 100% Editable
The Retail Dashboard Overview slide from the Lightweight Store Performance Dashboard PowerPoint Template offers a clear presentation of sales metrics and trends using editable slides with charts and tables. This layout supports business presentations such as quarterly performance reviews and sales strategy meetings by combining vector icons and data visualizations for effective evaluation.
What’s on This Slide
The layout features a top section with company metrics, including global sales and daily average sales, presented in rectangular boxes. Below, a table displays key store revenues with columns for total sales, discount, net sales, COGS, gross profit, and gross margin. To the right, a bar chart visualizes sales by category, while a circular chart shows conversion rates. Additional metrics include average basket value over time, represented in a line graph. Text placeholders are present for titles and data labels, aligned with visual elements for clarity.
How to Use It
This layout serves as a comprehensive performance dashboard, ideal for presenting sales data and insights. It fits well in a sequence following strategic analysis or inventory management slides. Business scenarios include quarterly performance reviews, sales strategy meetings, or investor presentations. The structured arrangement allows for easy comparison of metrics and trends, facilitating informed decision-making and strategic planning.
Text Placeholders & Capacity
Keep your copy within these limits so it fits without resizing. Text slots are tight, roughly 6-10 words each.
| Placeholder | Count | Max characters (approx.) |
|---|---|---|
| Slide title | 1 | 30 |
| Item heading | 6 | 20 |
| Chart title | 1 | 30 |
| Data label | 5 | 10 |
| Axis label | 1 | 20 |
Slide Keywords
Download unlimited PowerPoint templates, charts and graphics for your presentations with our annual plan.
DOWNLOADReturn to Lightweight Store Performance Dashboard PowerPoint Template.