Slide 12 of 14 from Key Customer Onboarding PowerPoint Template
Data Visualization Slide for Metrics for Success Presentation
Metrics for Success Slide in Customer Onboarding
- Chart
- Line Chart
- Metrics Slide
- 16:9
- 100% Editable
The Metrics for Success slide from the Key Customer Onboarding PowerPoint Template offers a clear line chart layout for tracking user adoption and customer satisfaction trends. This slide template is designed for business presentations focused on performance metrics, featuring editable shapes and vector icons to enhance corporate presentations and pitch decks.
What’s on This Slide
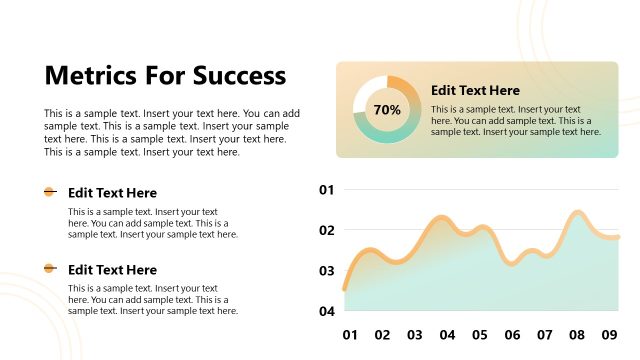
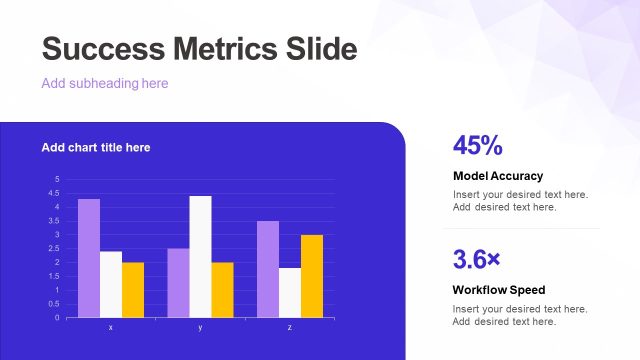
The layout features a line chart on the left side, displaying multiple metrics over six weeks, with a gradient color scheme of yellow and gray lines. The chart has a vertical axis labeled with values from 5 to 105 and a horizontal axis labeled with week markers W1 to W6. On the right side, there are two prominent text boxes: one for 'User Adoption' with a value of 92%, and another for 'Customer Satisfaction' showing 1.827. Each text box has a placeholder for additional text below it, aligned centrally. The background is dark blue with a light gradient.
How to Use It
This layout serves as a metrics overview, ideal for presenting key performance indicators in a customer onboarding context. It fits well after problem identification slides, providing a clear visual representation of user adoption and satisfaction metrics. This slide is useful for business meetings where tracking customer success metrics is essential, helping stakeholders understand progress and areas needing attention.
Text Placeholders & Capacity
Keep your copy within these limits so it fits without resizing. Node labels can hold about 2-3 words each, while body text can accommodate longer descriptions.
| Placeholder | Count | Max characters (approx.) |
|---|---|---|
| Chart title | 1 | 40 |
| Item heading | 2 | 20 |
| Item body | 2 | 150 |
Slide Keywords
Download unlimited PowerPoint templates, charts and graphics for your presentations with our annual plan.
DOWNLOADReturn to Key Customer Onboarding PowerPoint Template.