Slide 9 of 12 from AI-Powered Growth PowerPoint Template
Success Metrics Slide with Data Charts
Success Metrics Slide for AI Growth Presentation
- Chart
- Bar Vertical
- Evaluation Slide
- 16:9
- 100% Editable
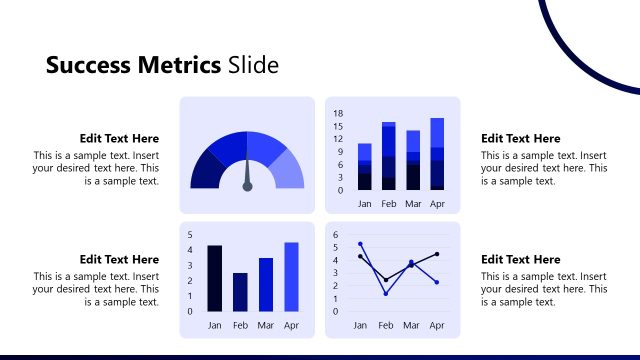
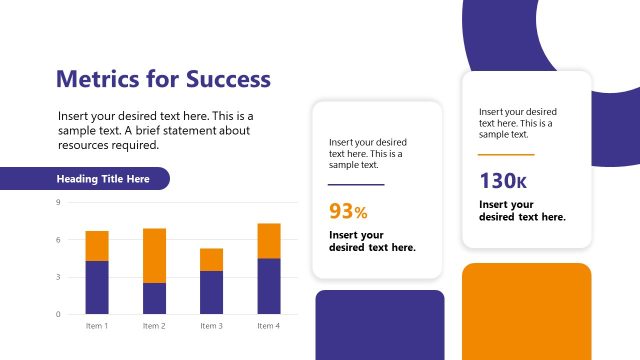
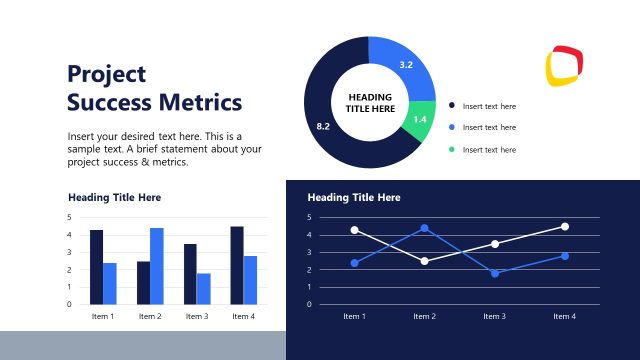
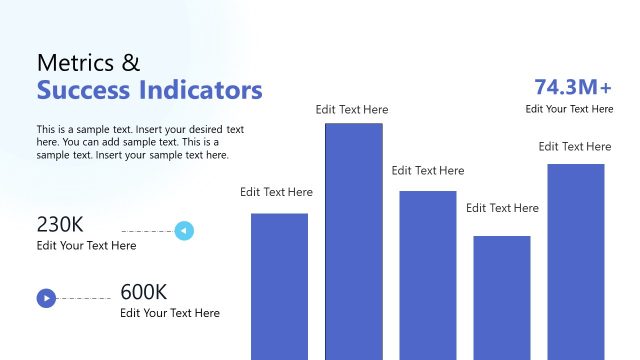
The Success Metrics Slide from the AI-Powered Growth PowerPoint Template offers a clear layout to present performance indicators using editable slides with a vertical bar chart and key metric boxes. This slide template supports business presentations by visualizing project success and evaluating outcomes effectively within a corporate presentation or pitch deck template.
What’s on This Slide
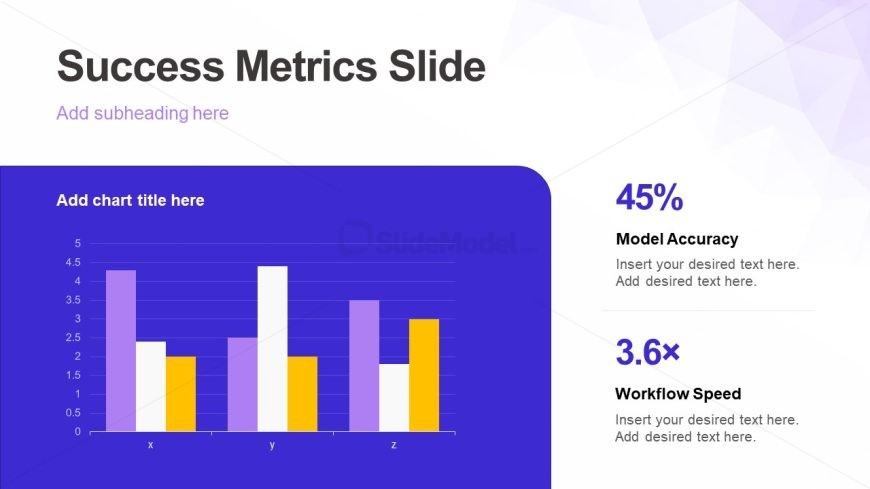
The layout includes a large bar chart on the left side, occupying most of the space. The chart has three bars labeled x, y, and z, with varying heights and colors: purple, yellow, and white. Above the chart, there is a placeholder for a chart title, aligned centrally. On the right side, two metric boxes display key performance indicators, with the first showing '45%' for model accuracy and the second showing '3.6×' for workflow speed. Each metric has a label below it, and there are text placeholders for additional information. The background features a gradient with purple tones.
How to Use It
This layout serves as a metrics presentation, ideal for showcasing performance indicators in a business context. It fits well after problem framing slides and before discussing solutions or strategies. Use it to present success metrics in AI projects, marketing campaigns, or operational improvements. This slide is beneficial for stakeholders needing to visualize progress and effectiveness, especially in data-driven environments.
Text Placeholders & Capacity
Keep your copy within these limits so it fits without resizing. Node labels can accommodate roughly 10 characters each.
| Placeholder | Count | Max characters (approx.) |
|---|---|---|
| Chart title | 1 | 30 |
| Item heading | 3 | 10 |
| Item body | 3 | 20 |
| Callout | 2 | 20 |
Slide Keywords
Download unlimited PowerPoint templates, charts and graphics for your presentations with our annual plan.
DOWNLOADReturn to AI-Powered Growth PowerPoint Template.