Slide 13 of 15 from AI Workforce Transition PowerPoint Template
Metrics & Success Indicators – AI Workforce Transition Template PPT Slide
Metrics and Success Indicators Slide
- Chart
- Bar Vertical
- Evaluation Slide
- 16:9
- 100% Editable
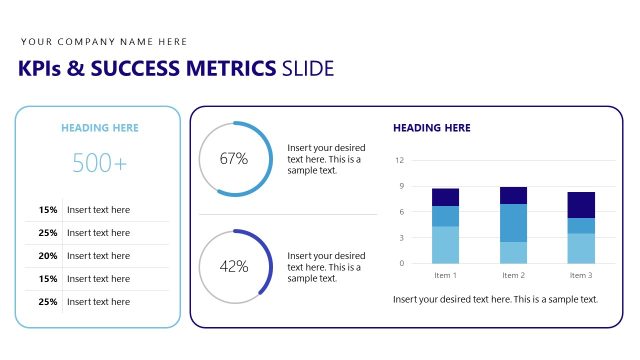
The Metrics and Success Indicators slide from the AI Workforce Transition PowerPoint Template offers a clear layout for visualizing key performance metrics using vertical bar charts. Designed for business presentations and quarterly reviews, this slide template supports data-driven discussions with editable shapes and text placeholders, enhancing the effectiveness of corporate presentations and pitch deck templates.
What’s on This Slide
The layout features a title at the top left, stating 'Metrics & Success Indicators.' Below, there is a text placeholder for a description, aligned left. To the right, a series of five vertical bars represent data points, each accompanied by a text placeholder for labels. The tallest bar is positioned furthest right, while the shortest is on the far left. Below the bars, two horizontal arrows point to text placeholders for additional metrics. The background is a light gradient, enhancing visual clarity. All elements are organized for easy comprehension.
How to Use It
This layout serves to present key performance metrics and success indicators in a clear and structured manner. It is suitable for business presentations where performance data needs to be highlighted, such as quarterly reviews or project evaluations. This slide fits well after problem identification slides, allowing for a smooth transition into discussing metrics. It is ideal for scenarios requiring data visualization to support strategic decisions.
Text Placeholders & Capacity
Keep your copy within these limits so it fits without resizing. Body slots can hold around 15-20 words each.
| Placeholder | Count | Max characters (approx.) |
|---|---|---|
| Slide title | 1 | 30 |
| Body paragraph | 1 | 150 |
| Item heading | 5 | 10 |
| Item body | 5 | 20 |
Slide Keywords
Download unlimited PowerPoint templates, charts and graphics for your presentations with our annual plan.
DOWNLOADReturn to AI Workforce Transition PowerPoint Template.