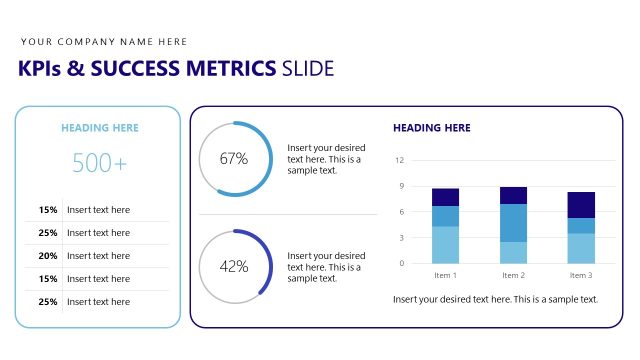
Slide 9 of 12 from Corporate Wellness PowerPoint Template
Success Metrics & KPIs Presentation Slide – Corporate Wellness Presentation
Success Metrics & KPIs Slide
- Chart
- Bar Vertical
- Evaluation Slide
- 16:9
- 100% Editable
The Success Metrics & KPIs slide from the Corporate Wellness PowerPoint Template offers a clear visualization of performance indicators using editable slides with a vertical bar chart and concise data points. This layout supports business presentations by effectively highlighting employee engagement and productivity improvements, making it a practical choice for corporate presentation slide decks focused on wellness program outcomes.
What’s on This Slide
The layout features a bar chart on the left, displaying monthly data from January to August. The chart has dark blue bars representing values on a vertical axis ranging from 0 to 90. To the right, three text placeholders are arranged vertically, each with a bold percentage figure followed by a label. The first placeholder shows '92%' for Employee Participation, the second '35%' for Productivity Improvement, and the third '951.28K' for Employee Participation again. The background is light blue, providing contrast to the dark elements.
How to Use It
This layout serves to present key performance indicators and success metrics in a clear, structured manner. It fits well after a problem-framing slide to showcase progress or outcomes. This slide is suitable for business presentations focusing on employee engagement, productivity metrics, or wellness program effectiveness, allowing stakeholders to quickly grasp performance data.
Text Placeholders & Capacity
Keep your copy within these limits so it fits without resizing. Node labels can accommodate roughly 2-3 words each.
| Placeholder | Count | Max characters (approx.) |
|---|---|---|
| Chart title | 1 | 30 |
| Item heading | 3 | 20 |
| Item body | 3 | 50 |
Slide Keywords
Download unlimited PowerPoint templates, charts and graphics for your presentations with our annual plan.
DOWNLOADReturn to Corporate Wellness PowerPoint Template.