Slide 8 of 8 from Detroit PowerPoint Template
Multiple Bar Chart Template for Detroit
Bar Chart Slide for Presentations
- Chart
- Bar Vertical
- Evaluation Slide
- 16:9
- 100% Editable
What’s on This Slide
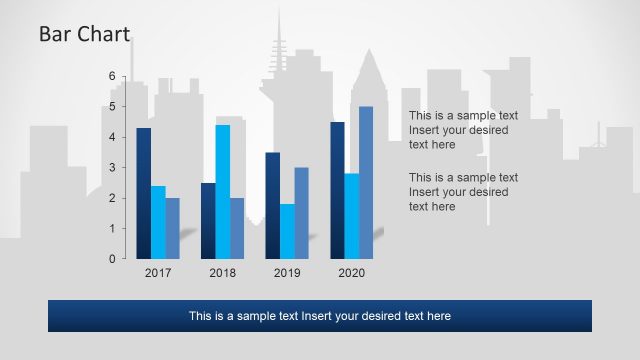
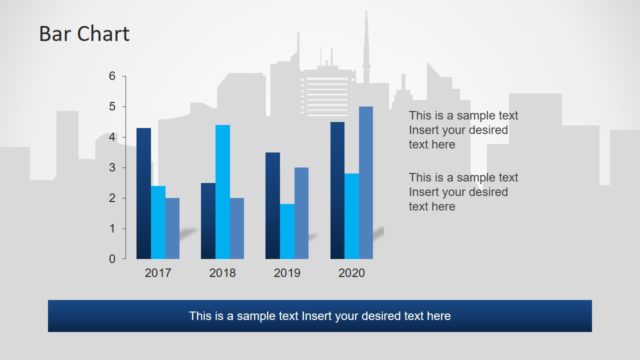
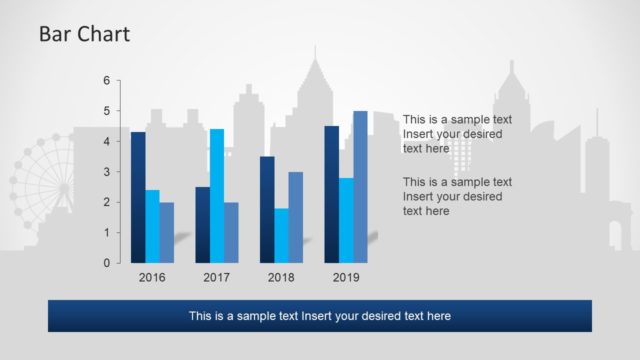
The slide features a vertical bar chart on the right side, displaying data for the years 2014 to 2017. Each bar is colored in varying shades of blue, with a light gray city skyline silhouette in the background. The chart has a vertical axis labeled with numbers from 0 to 6, indicating data values. Below the chart, there is a dark blue rectangular text placeholder for additional commentary. The title 'Bar Chart' is positioned at the top left, with a larger font size than the chart labels. Text placeholders are aligned to the right of the chart.
How to Use It
This layout serves as a data visualization tool, ideal for presenting quantitative information in a clear format. It fits well in a presentation sequence after introducing a topic or problem, providing a visual summary of key metrics. This slide is suitable for business reports, performance reviews, or market analysis where comparisons over time are necessary. It can be used to highlight trends or changes in data across specified years, making it effective for stakeholders needing data-driven insights.
Text Placeholders & Capacity
Keep your copy within these limits so it fits without resizing. Text slots can hold concise information, with body text limited to about 10 words each.
| Placeholder | Count | Max characters (approx.) |
|---|---|---|
| Chart title | 1 | 20 |
| Item heading | 4 | 4 |
| Item body | 4 | 30 |
| Body paragraph | 1 | 60 |
Slide Keywords
Download unlimited PowerPoint templates, charts and graphics for your presentations with our annual plan.
DOWNLOADReturn to Detroit PowerPoint Template.