House of Quality PowerPoint Template provides a creative diagram representing the Quality Function Deployment (QFD) technique.
The house of quality template includes a diagram in the presentation slides, which resembles a house, used for mapping the relationship between customer needs and the product capabilities. House of Quality is a tool used as part of the Quality Function Deployment (QFD) and it uses as a basis a planning matrix to relate what the customer wants to how a producer meets those needs. The correlation matrix on top of the planning matrix resembles as the house roof.
The Quality function deployment (QFD) is a technique used to transform qualitative user needs into quantitative parameters, in other words, transform customer needs into engineering characteristics, prioritizing each characteristic while simultaneously setting development targets.
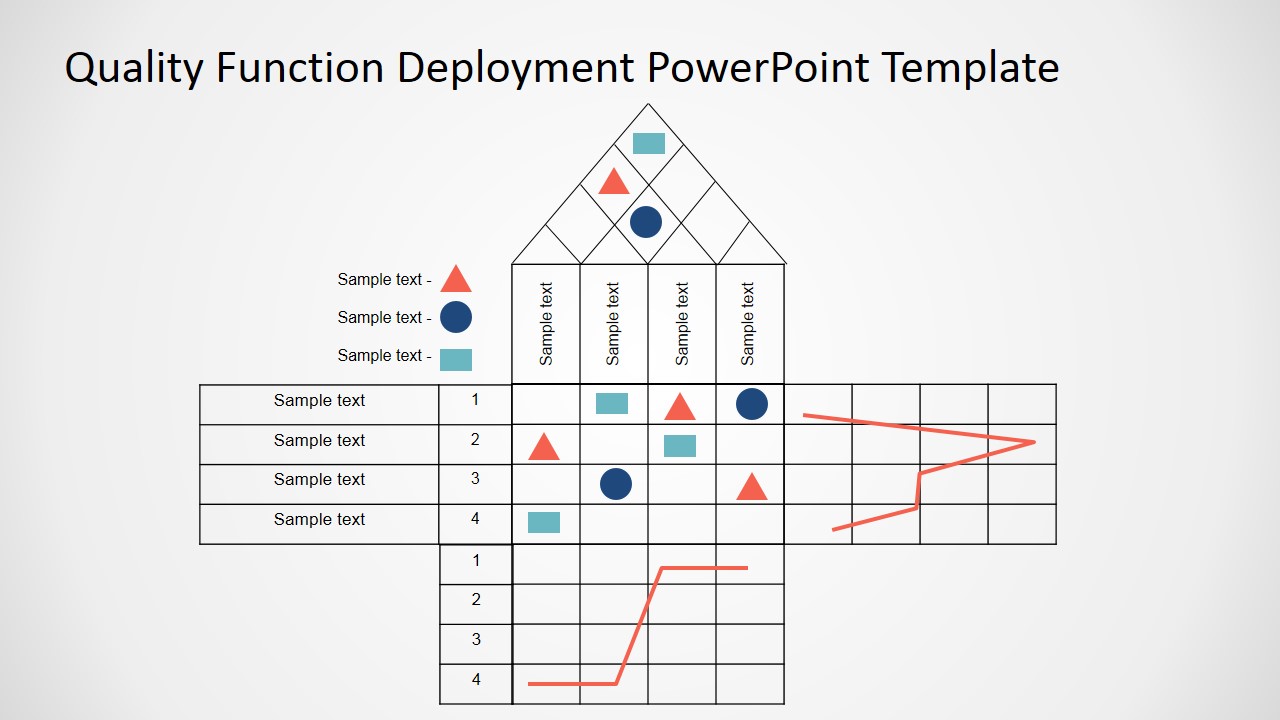
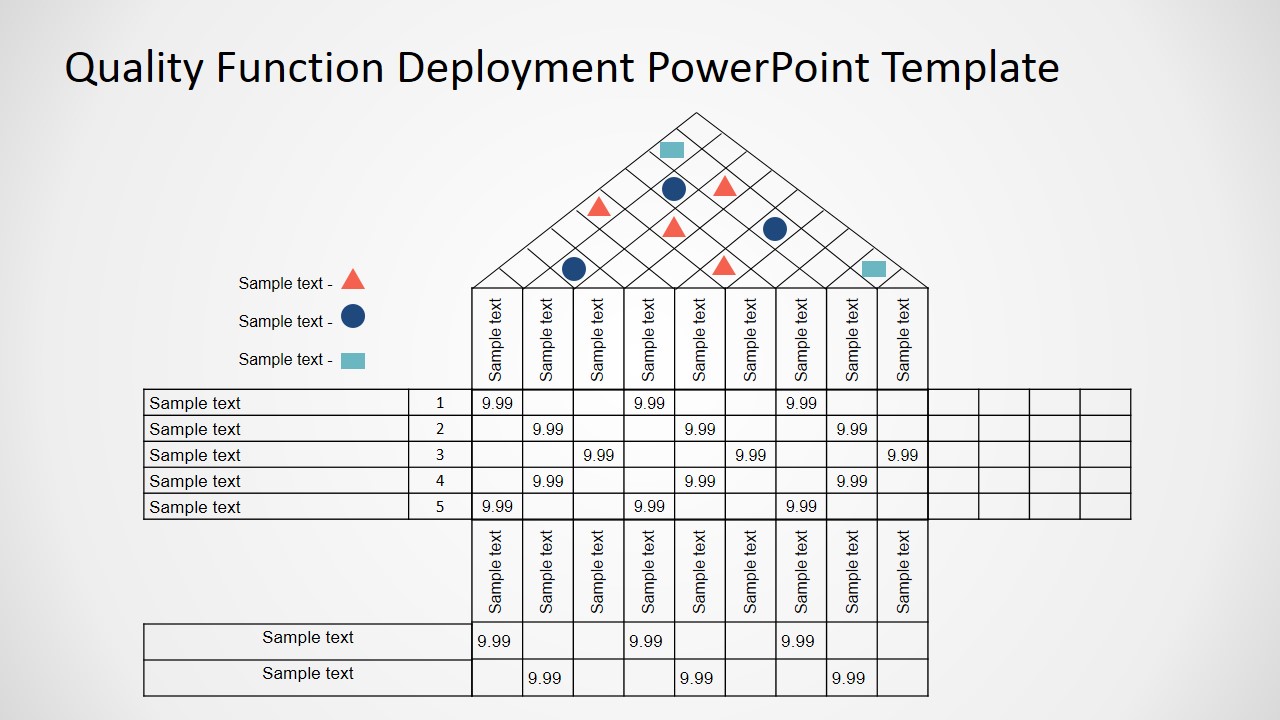
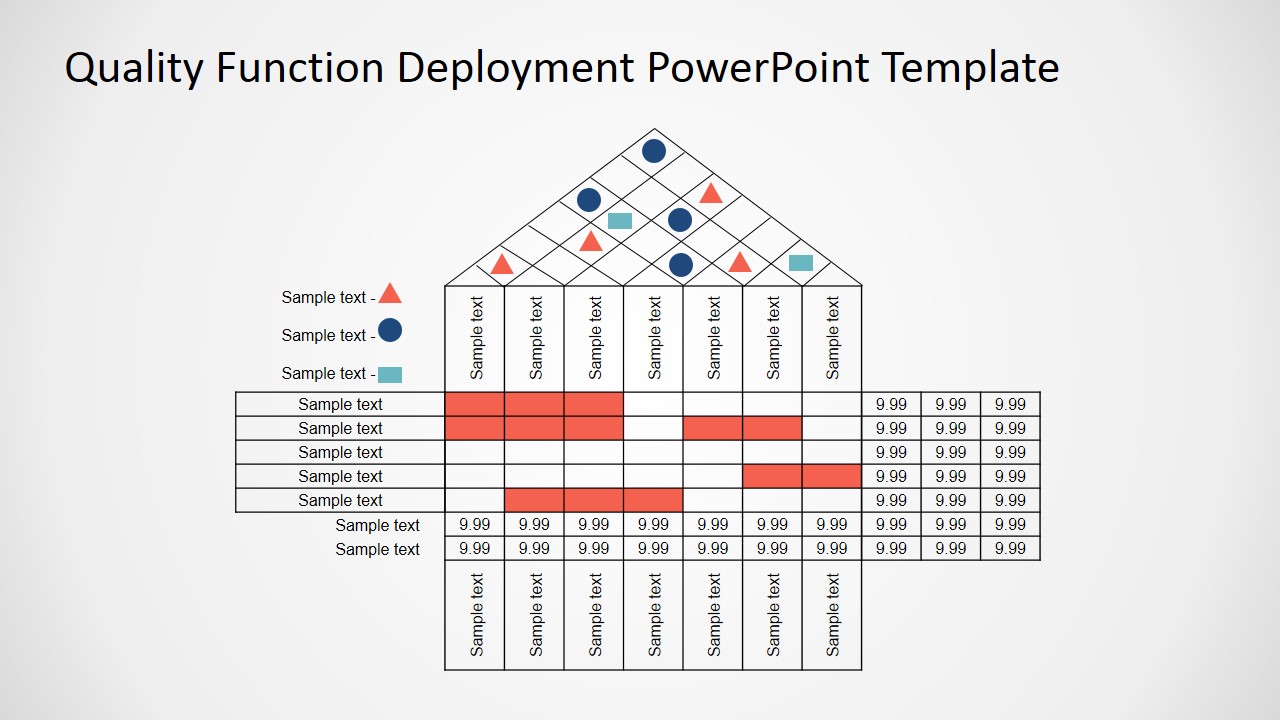
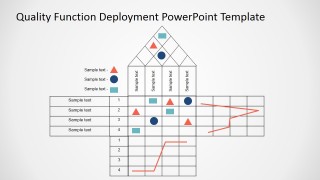
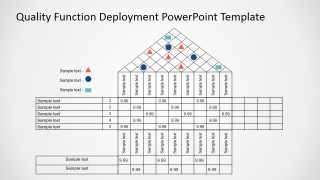
The first PowerPoint Diagram is a 4×4 planning matrix. It provides the main matrix, with three different series icons. On the right side of the matrix, editable line graphics are displayed for the user to map requirements vs implementations.On the top of the matrix, the correlation matrix (triangular shapes) is displayed with series icons inside. The second Diagram is a 5×9 Matrix, following the same characteristics of the previous diagram.
Each of the matrices is created using PowerPoint Tables and PowerPoint Shape templates, allowing the user to fully customize and scale the tool without losing any quality. Describe your high level house of quality with this professional House of Quality PowerPoint Template. You can download it for PowerPoint & Google Slides. Alternatively, you can download other quality PPT templates.
What’s inside this template
Example presentation scenarios
- A product manager can use the wide House of Quality matrix to show how customer needs map to engineering characteristics during a new product planning review.
- A quality engineer can use the correlation roof and relationship markers to explain trade-offs between technical requirements in a design validation meeting.
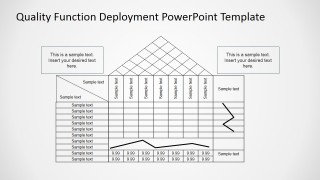
- A manufacturing team lead can use the blank worksheet layout with callout boxes to facilitate a QFD workshop and collect stakeholder input.
- A process improvement consultant can use the compact matrix and numeric priority table to summarize requirement importance and implementation focus for executives.
Features
- 100% editable presentation template
- Compatible with Microsoft PowerPoint and Google Slides
- 16:9 aspect ratio slides
- Scalable vector shapes, icons and illustrations
- AI-Ready for Microsoft Copilot and Claude
- Instant access and download
Frequently asked questions
Q: How should a presenter explain a House of Quality matrix without overwhelming the audience?
A: Start with the customer requirement rows, then move to the technical characteristic columns before discussing the relationship markers. The visible roof should be introduced last as the place where technical characteristics reinforce or conflict with each other. This sequence keeps the audience focused on why each engineering priority exists.
Q: Who is this template best suited for in a product development meeting?
A: This template fits product managers, quality engineers, systems engineers, and manufacturing stakeholders who need one shared view of customer needs and technical responses. It is strongest when the meeting goal is to align priorities, compare relationship strength, and document trade-offs using the QFD matrix rather than narrative-only slides.
Q: Why use the house metaphor instead of a standard table?
A: The house shape separates the planning problem into recognizable zones: customer needs on one side, technical characteristics across the top, relationships in the main body, and correlations in the roof. That visual metaphor helps technical and nontechnical stakeholders see that product quality depends on connected requirements, not isolated checklist items.

House of Quality PowerPoint Template
4-slide presentation template for House of Quality QFD matrices, planning tables, and correlation roofs
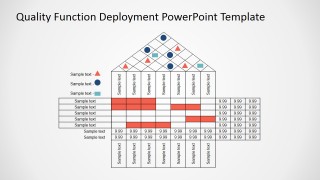
The House of Quality PowerPoint Template is a 4-slide QFD diagram set for mapping customer needs against engineering characteristics. It includes compact and wide planning matrices, roof correlation matrices, relationship icon legends, numeric priority tables, and side comparison plots for product managers, engineers, and quality teams in PowerPoint and Google Slides.
- Category
- Diagrams
- Rating


 Loading...
- Aspect ratio
- 16:9, 4:3
- Item ID
- 7001-01
- Colors
 Microsoft PowerPoint
 Microsoft Copilot
 Claude for PowerPoint
Other formats supported
Subscribe today and get immediate
access to download our PowerPoint templates.