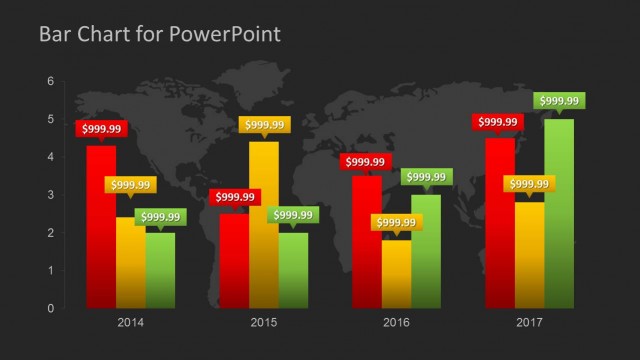
Slide 1 of 2 from Global Sales Bar Chart Template for PowerPoint
Data Driven Editable Column Chart for PowerPoint
Global Sales Bar Chart for PowerPoint
- Chart
- Bar Vertical
- Evaluation Slide
- 16:9
- 100% Editable
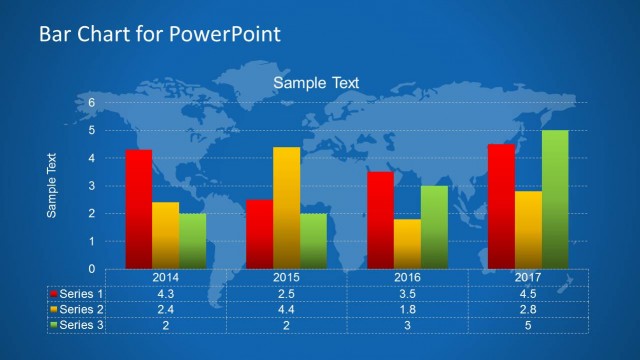
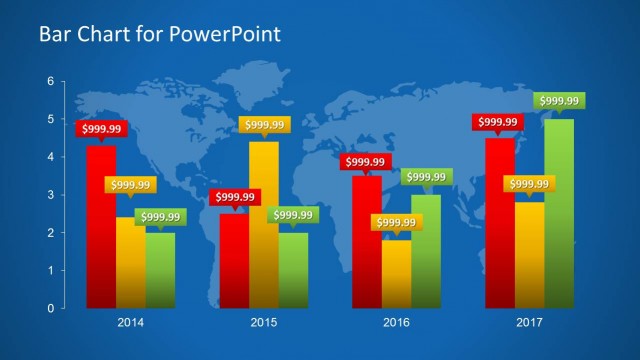
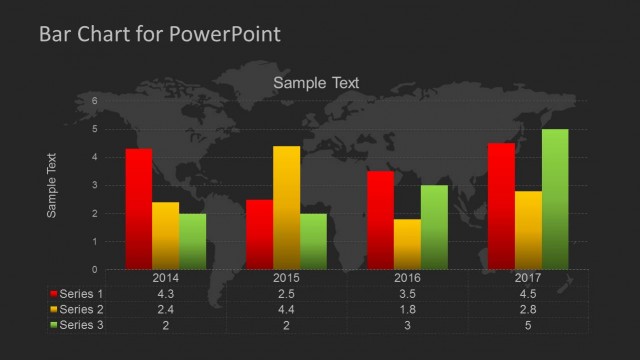
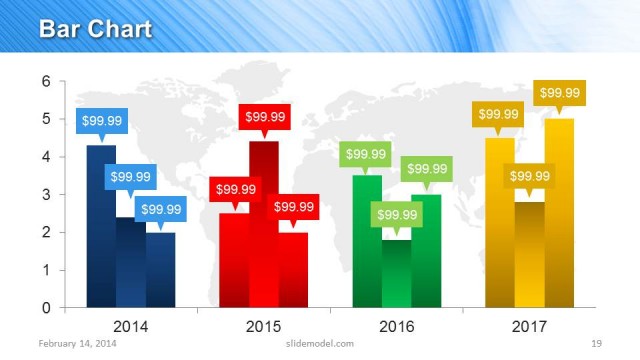
The Global Sales Bar Chart slide from the Global Sales Bar Chart Template for PowerPoint offers a clear visual comparison of regional sales performance over multiple years. This slide layout is ideal for business presentations and management reporting, utilizing editable shapes and vector icons to enhance data clarity in sales performance reviews and regional sales comparisons.
What’s on This Slide
The slide features a bar chart with three colored bars representing sales data for America, EMEA, and Asia over four years. The bars are arranged vertically for each year, with Year labels positioned at the bottom. The chart has a blue grid background with a faint world map. The y-axis indicates sales amounts ranging from $0 to $250,000, while the x-axis displays the years. Text placeholders exist for the title and axis labels, aligned at the top and bottom respectively, maintaining a clear visual hierarchy.
How to Use It
This layout serves as a data visualization tool, effectively comparing sales figures across regions and years. It fits well in presentations focused on sales performance analysis or regional comparisons. This structure is useful for business reports, management meetings, or quarterly reviews, where stakeholders need to assess sales trends and make informed decisions based on visual data representation.
Text Placeholders & Capacity
Keep your copy within these limits so it fits without resizing. Title and axis slots can hold concise text, roughly 3-5 words each.
| Placeholder | Count | Max characters (approx.) |
|---|---|---|
| Slide title | 1 | 30 |
| Axis label | 2 | 20 |
| Data label | 12 | 10 |
Slide Keywords
Download unlimited PowerPoint templates, charts and graphics for your presentations with our annual plan.
DOWNLOAD