From A to B Infographic PowerPoint Template
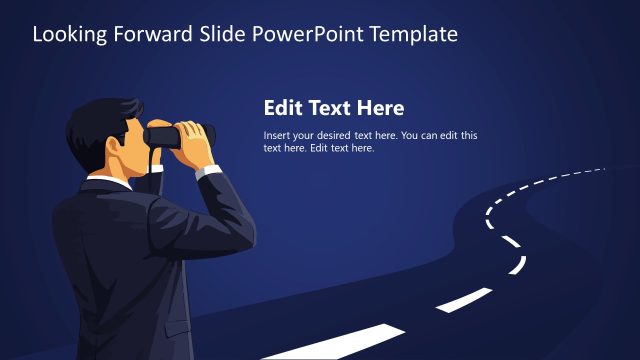
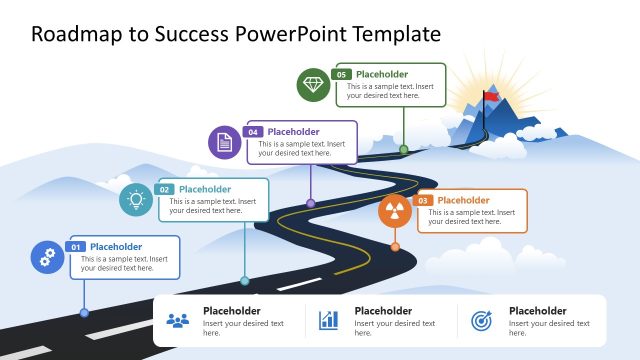
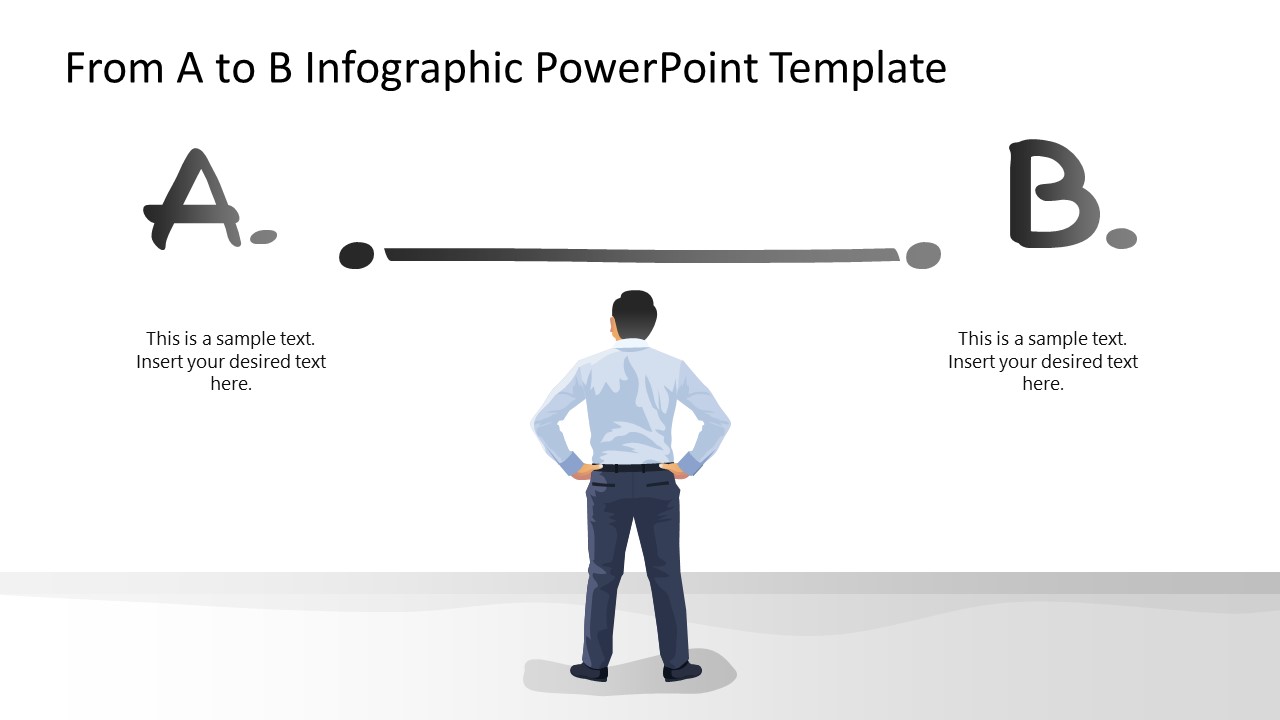
Visualizing the transition from the current state to a future objective requires a narrative that captures both the scale of the goal and the roadmap for achieving it. This From A to B Infographic PowerPoint Template provides a minimalist, high-impact layout for illustrating organizational journeys, strategic pivots, or performance scaling. By using a spatial perspective, this asset helps stakeholders internalize the distance between an initial “Point A” and the desired “Point B,” making abstract growth targets feel tangible and actionable.
Our infographic PPT template is engineered for high-level Executive Briefings and Project Roadmapping, offering several professional use cases:
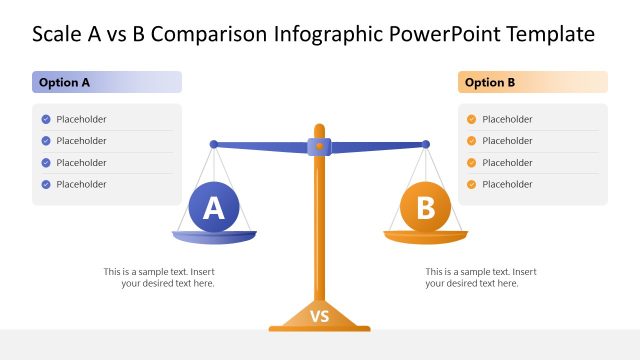
- Gap Analysis: Clearly contrast the current operational reality with the targeted future state to identify necessary resource allocations.
- Performance Scaling: Map the trajectory from existing sales benchmarks to aggressive new targets for upcoming fiscal quarters.
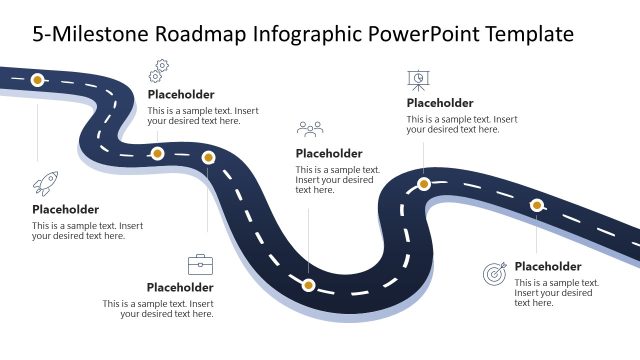
- Zero-to-Hero Narratives: Document a project’s lifecycle from the initial “Alpha” phase through to final market deployment and success.
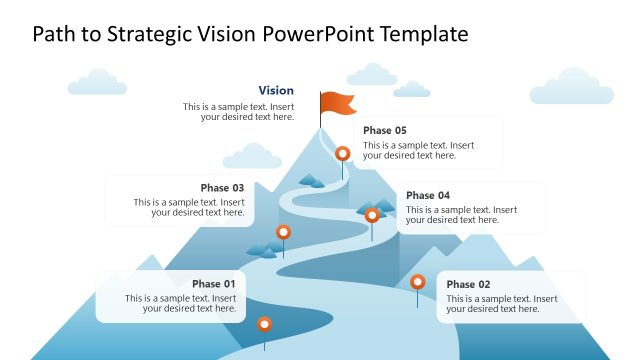
- Strategic Visioning: Align team members on a unified path forward, using the visual metaphor of the “journey” to simplify complex technical transitions.
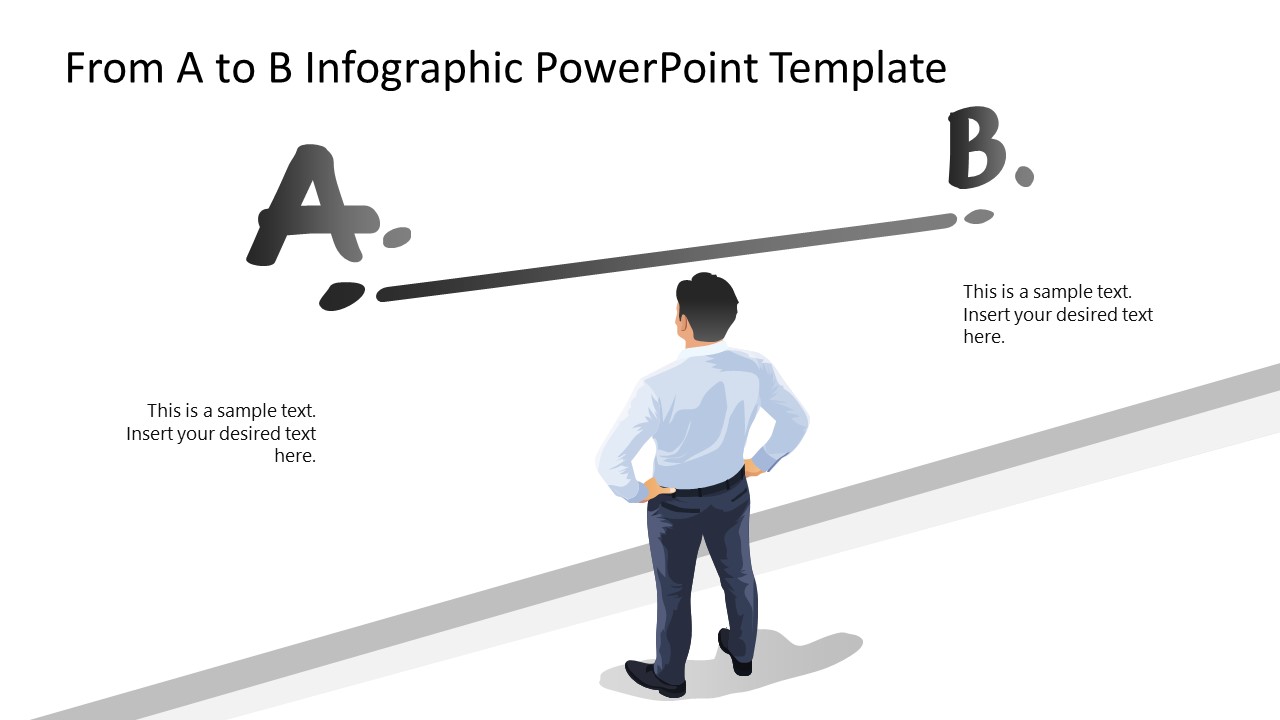
The slide’s aesthetic features a unique 3D Isometric Perspective, with a professional character illustration serving as the observer of the strategic path. This “human-centric” design fosters accountability and leadership, ideal for Program Managers or Business Owners who need to demonstrate personal oversight of a project’s evolution. The design utilizes creative, high-contrast typography and a clean horizon line to maintain a strong Visual Hierarchy, ensuring that your primary data points remain the focal point even in high-density presentations.
Constructed as a vector-based asset, every element, from the character illustration to the custom-style lettering, is fully editable and scalable for 16:9 widescreen displays. The deck includes two distinct camera angles (rear view and side perspective) to provide variety in storytelling while maintaining visual continuity. Fully optimized for Microsoft PowerPoint and Google Slides, this layout eliminates the need for manual design work, allowing you to focus on codifying your Implementation Strategy and driving stakeholder alignment.
Define your trajectory with clarity. Download the From A to B Journey Infographic PPT Template to visualize your next strategic milestone.

You must be logged in to download this file.
DOWNLOAD- Category
- Diagrams
- Rating

 Loading...
- Size
- 16x9
- Item ID
- 23535-01
- Colors
Subscribe today and get immediate
access to download our PowerPoint templates.