Flat Business Bar Chart Slide Design
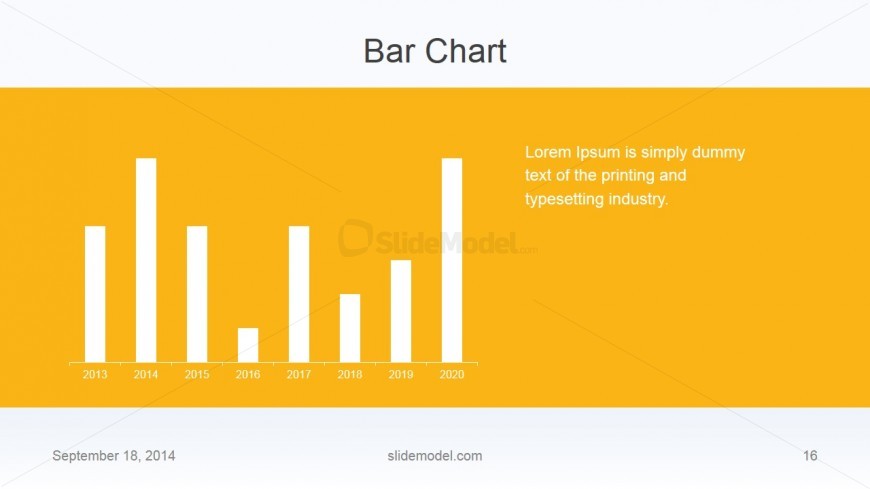
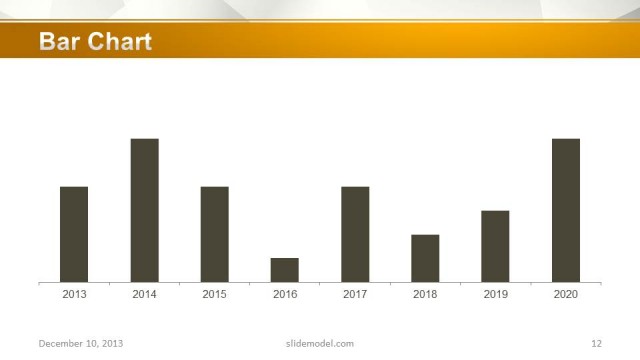
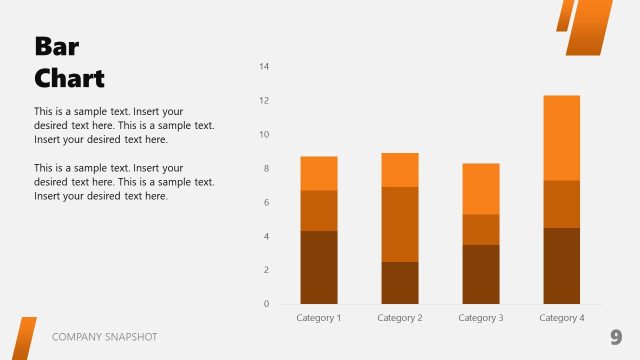
The PowerPoint slide contains a Flat Business Bar Chart Slide Design. Traditionally, bar charts are used to show and compare different sets of data across several years. This allows both the audience and the presenter to track trends in statistical data. The design lets the presenter show forecasts, as well as historical data.
The main feature of the slide is a bar graph against a yellow presentation background. The bars are shown in white so they stand out against the color. Beside the chart is a text placeholder where the presenter can place descriptions of the content. The PowerPoint objects are 100% customizable and can be edited to suit the presenter’s needs and preferences.
Return to Flat Business PowerPoint Template.
Download unlimited PowerPoint templates, charts and graphics for your presentations with our annual plan.
DOWNLOADReturn to Flat Business PowerPoint Template.
