Operating Income Compared to Operating Margin PowerPoint Slide
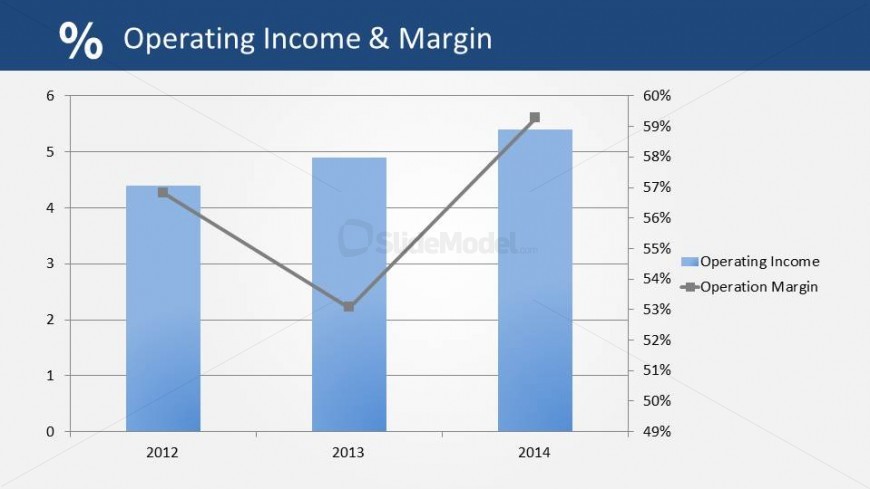
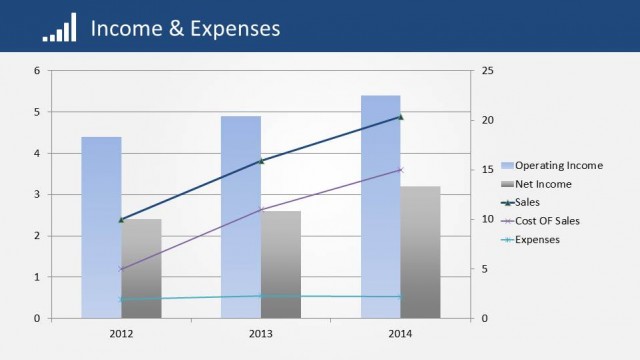
The Office template features an Operating Income Compared to Operating Margin PowerPoint Slide. Operating income refers to the earnings before interest, taxes, amortization and depreciation, otherwise known as EBITDA. These are important financial statistics that are extremely relevant when making financial decisions.
These data are presented through a combination of a bar graph and line graph. The operating income is represented by the bars, while the line represents the operating margin. A set of percentages serve as labels for the axes, as well as years. The PowerPoint objects are 100% customizable and can be edited to suit the presenter’s needs and preferences.
Return to Financial Statements PowerPoint Template.