Revenues and Expenses Categories Donut Charts
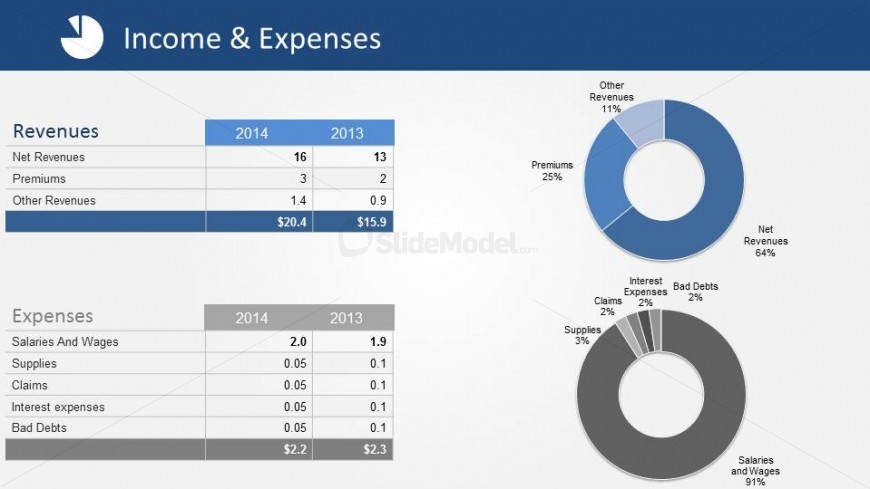
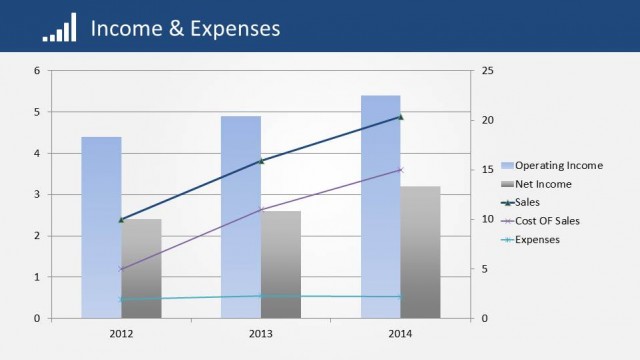
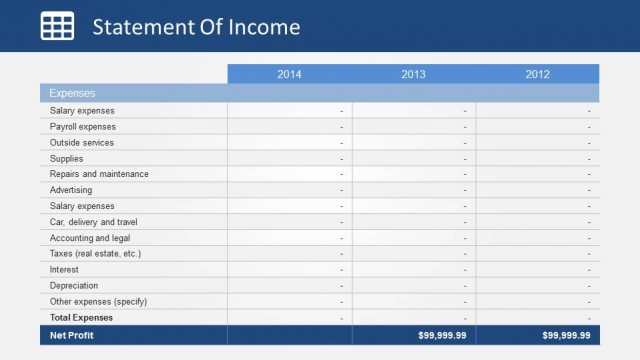
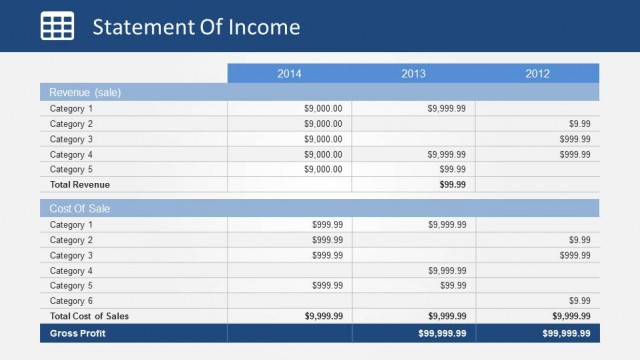
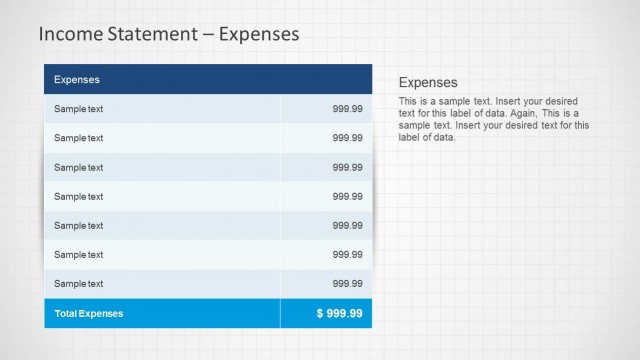
The PowerPoint slide shows a Revenues and Expenses Categories Donut Chart. It can be used to display the components of a company’s net profit. The slide design specifically features the main line items of revenues and expenses. These features allow the presenter to show an overview of the company’s financial standing.
Included in the slide are tables and donut charts corresponding to the different revenues and expenses. The donut charts reflect the data found in the tables. These charts provide a visual representation of the composition of the company’s income and expense items. The PowerPoint objects are 100% customizable and can be edited to suit the presenter’s needs and preferences.
Return to Financial Statements PowerPoint Template.