Economic Outlook PowerPoint Template is a presentation template that helps you to prepare an Economic Outlook slide design in PowerPoint. You can use this PowerPoint slide design to make financial and economics PowerPoint presentations as well as other business presentations including middle market slide designs, local economy, territory or US economy and global economy slides.
What’s inside this template
Example presentation scenarios
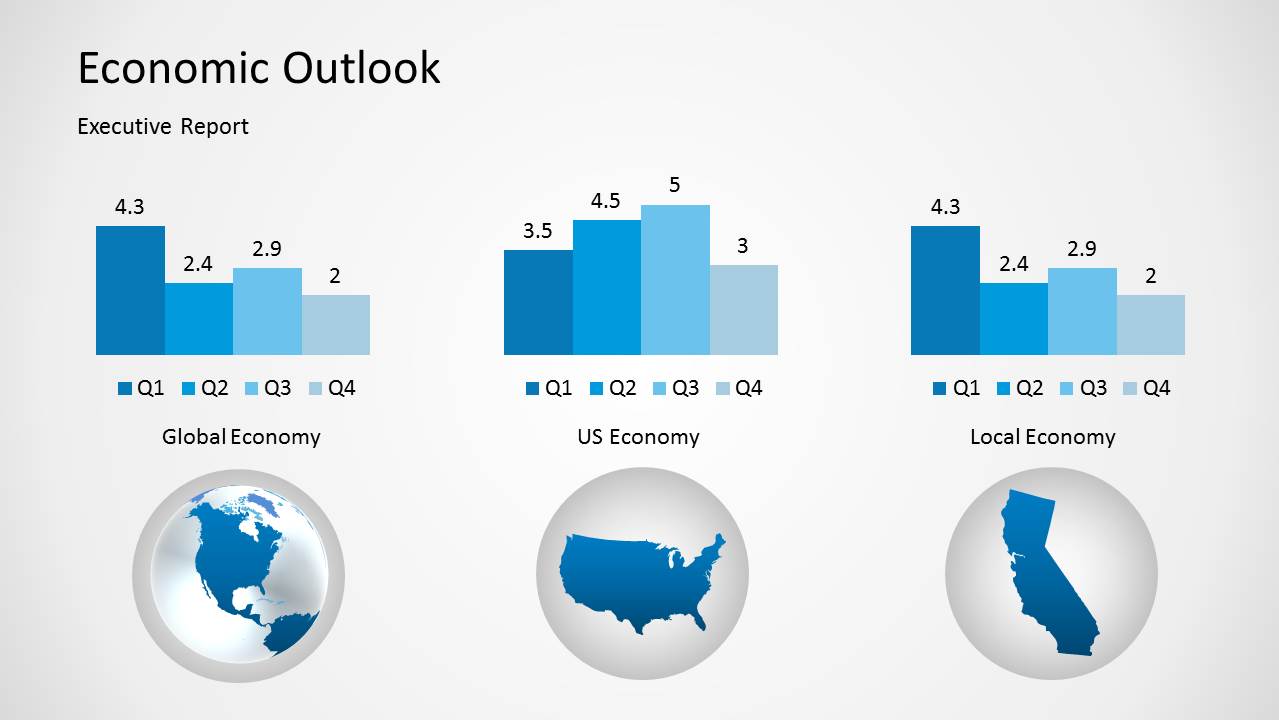
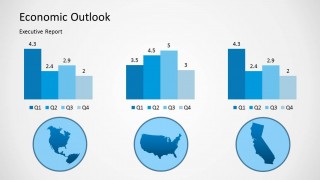
- A financial analyst can brief executives on quarterly economic movement by replacing the Q1-Q4 bar chart values and using the global, US, and local economy labels to compare market levels.
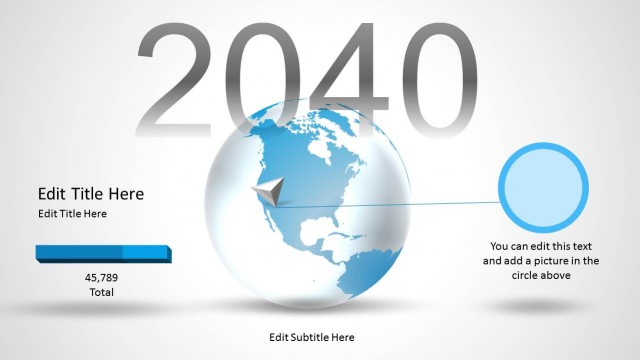
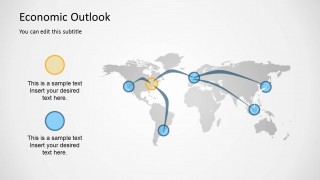
- A consultant can explain regional exposure to a client by using the world connection map to show cross-border relationships, trade routes, or market dependencies with editable location markers.
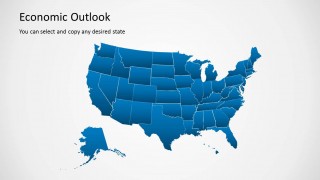
- An economic development presenter can focus on domestic territory planning by using the selectable US state map to isolate priority states and discuss local performance.
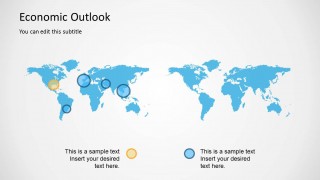
- A market research team can present global and local context in one short report by combining the three economy comparison slide with the two-panel world map slide.
Features
- 100% editable presentation template
- Compatible with Microsoft PowerPoint and Google Slides
- Scalable vector shapes, icons and illustrations
- AI-Ready for Microsoft Copilot and Claude
- Instant access and download
Frequently asked questions
Q: How should a presenter organize the economic message with this template?
A: Start with the bar chart slide to establish the numeric pattern across global, US, and local views. Then move to the world map to explain where the activity is happening and why geography matters. Use the US state map only when the audience needs a domestic territory or regional focus.
Q: Who is this template best suited for in a business presentation?
A: It fits analysts, consultants, economists, and strategy teams who need to report economic conditions without building a full dashboard. The slides work best for short executive briefings where quarterly comparison, global relationships, and US regional context are more important than detailed financial modeling.
Q: Why do the map layouts improve an economic outlook presentation?
A: The maps add a geographic metaphor to the numbers: markets are not abstract, they are tied to regions, routes, and territories. The route lines, locator circles, and selectable US states help the audience connect chart trends to physical market exposure, making the report easier to follow.


Economic Outlook PowerPoint Template
5-slide economic outlook presentation template with quarterly bar charts, world maps, and US territory visuals
The Economic Outlook PowerPoint Template is a 5-slide business presentation for executive economic reporting. It includes quarterly bar chart comparisons, global, US, and local economy map views, world connection maps, and a selectable US state map. Financial analysts, consultants, and leadership teams can use it in PowerPoint. Bar chart data can be edited as an Excel spreadsheet in PowerPoint.
- Category
- Business PowerPoint Templates
- Rating

 Loading...
- Item ID
- 8086-ec
- Colors
 Microsoft PowerPoint
  Microsoft Copilot
  Claude for PowerPoint
 Other formats supported
Subscribe today and get immediate
access to download our PowerPoint templates.