Business Cycle PowerPoint Template
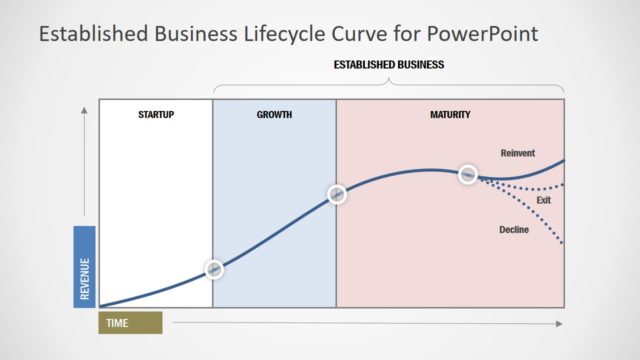
The Business Cycle PowerPoint Template is an editable wave-like graphical diagram to present phases of the business cycle. The business cycle, also known as the economic cycle, refers to the multiple nationwide economic fluctuations observed for a few months or a year. These economic trends are determined by calculating the real-time Gross Domestic Product (GDP) values. The GDP depends upon various factors related to business and industry, e.g., income, sales, production, and employment. Thus, a business cycle or also known as economic cycle supports business professionals and investors in making crucial and in-time business decisions regarding the prevailing economic conditions.
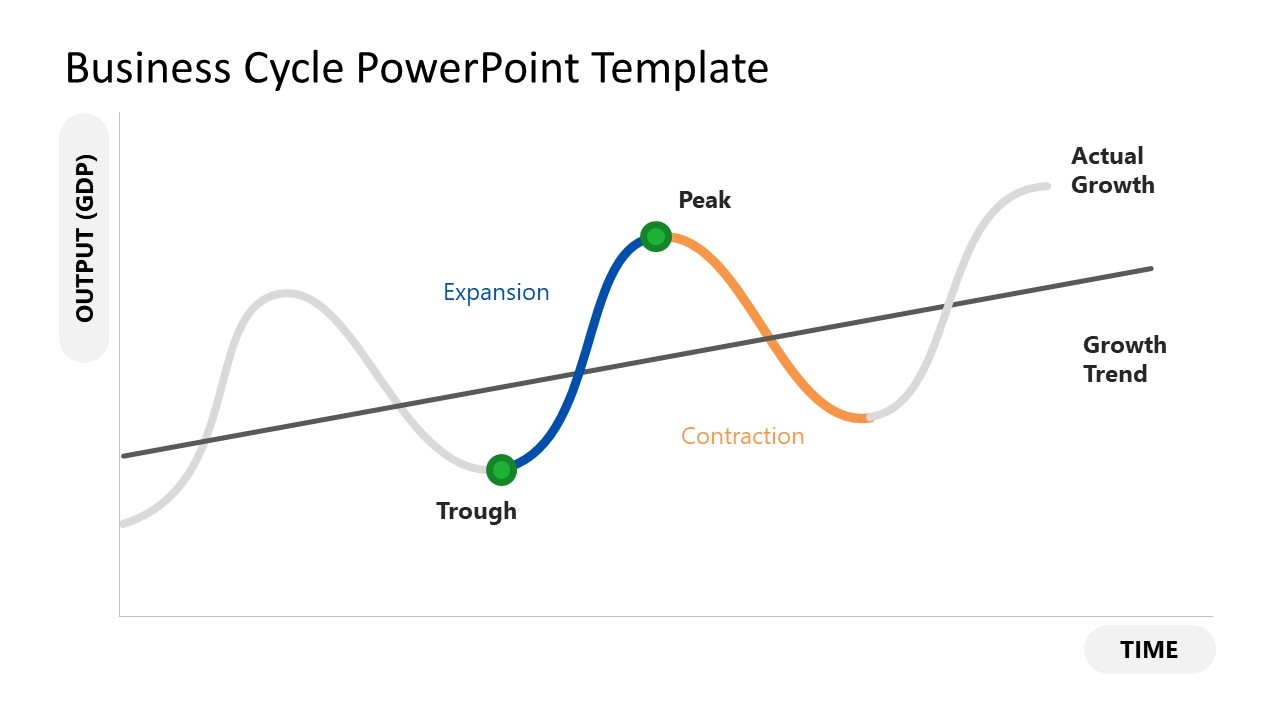
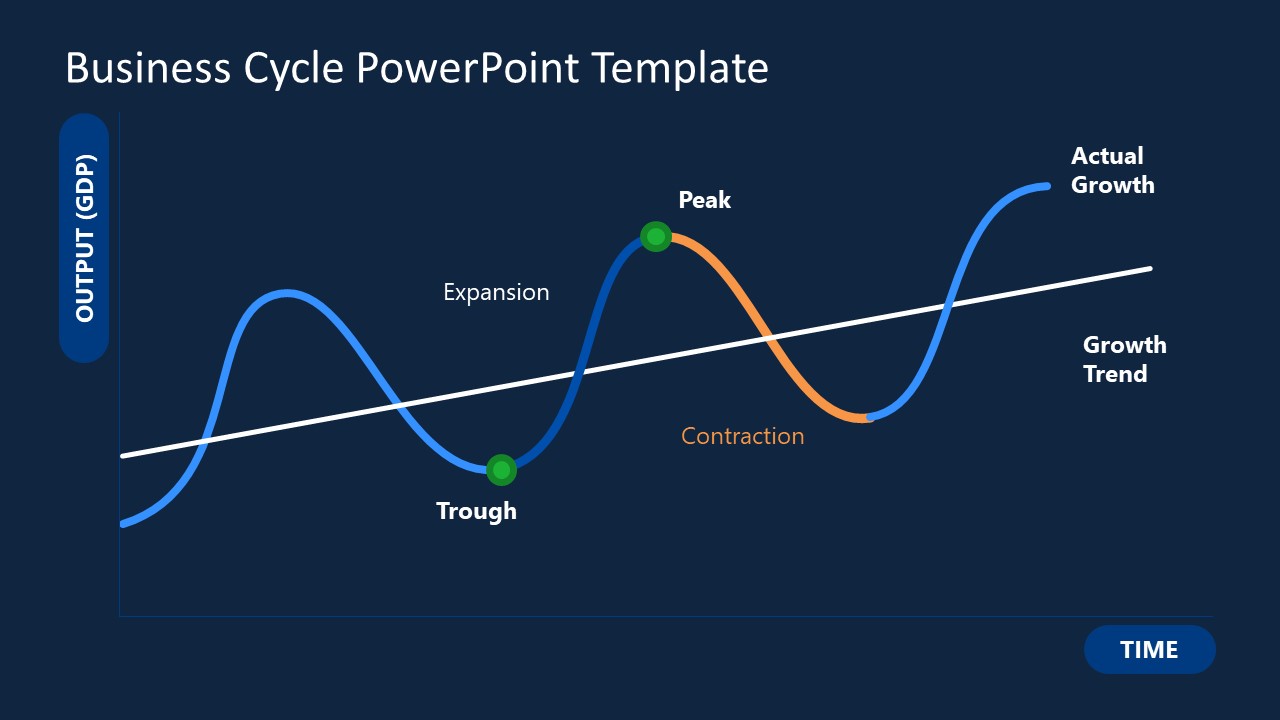
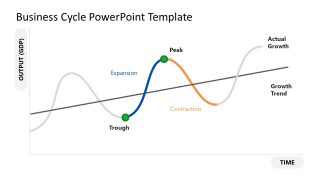
This PowerPoint template is a visual representation of the business cycle, sometimes known as the boom-bust cycle. Presenters can choose between the two background color variants of the slide for their presentations. The template slide is a graph chart that shows the time and output (GDP) factors along the x and y-axis, respectively. There is a continuous wave-like graph between the axes having repeated peaks and troughs. The peaks indicate a phase where the GDP production is maximum for a business cycle diagram. In contrast, the troughs represent the points of downfall. The upward trend of the economic condition between trough and peak is known as expansion. While the contraction denotes a downward trend. Both these phases are represented through colored lines in this diagram.
The remaining wave line is grey, and a diagonal line passes across the center. This line depicts the ideal growth trend while the wave indicates the actual one. We have designed this Business Cycle PowerPoint Template to showcase different economic trends. Presenters can color other parts of the wave line and thus present this business cycle before investors and business executives. So, download this entirely editable PPT template and discuss the impacts and outcomes of the economic trends or present the different present phases of the business cycles. You can edit this diagram using PowerPoint or Google Slides or alternatively download other business cycle slides and diagrams for presentations including, boom-bust cycle curves, year-over-year comparison slides, supply & demand slides and other curves and timeline PPT designs.

You must be logged in to download this file.
DOWNLOAD- Category
- Business PowerPoint Templates
- Rating

 Loading...
- Size
- 16x9
- Item ID
- 21457-02
- Colors
Subscribe today and get immediate
access to download our PowerPoint templates.