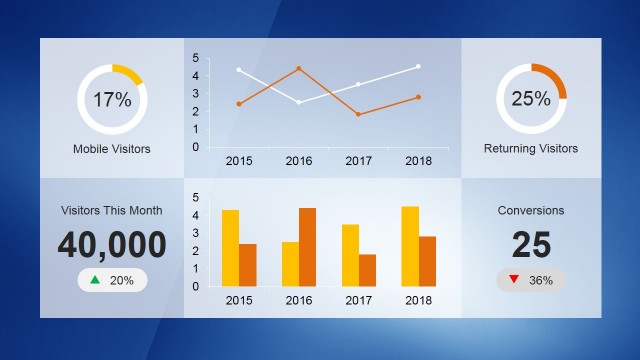
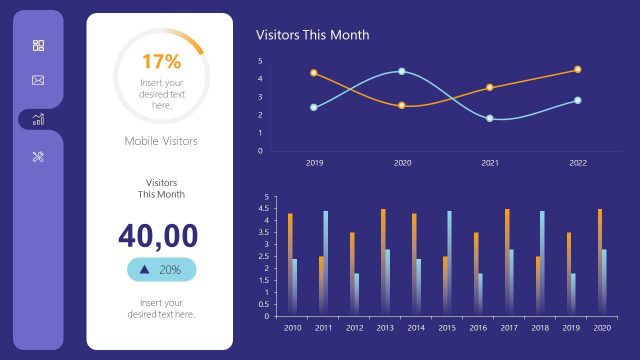
Donut Chart and Absolute Numbers Squares KPI Dashboard

The PowerPoint slide shows a Donut Chart and Absolute Numbers Squares KPI Dashboard. In this slide design, key performance indicators (KPIs) are featured set in four quadrants of equal sizes. First quadrant contains a donut chart with figure for Mobile Visitors. Another donut chart has figure for Returning Visitors. The third quadrant contains figure for Visitors This Month with a green triangle indicating increase. The last has figure for Conversions with a red inverted triangle indicating decrease.
Use this slide design to discuss KPIs in an engaging manner. The visually appealing format will aid the presenter in getting message across. The figures and values can be edited and recalculated through MS Excel.
Return to KPI Dashboard Template for PowerPoint.