Circular Packing Diagram PowerPoint Template
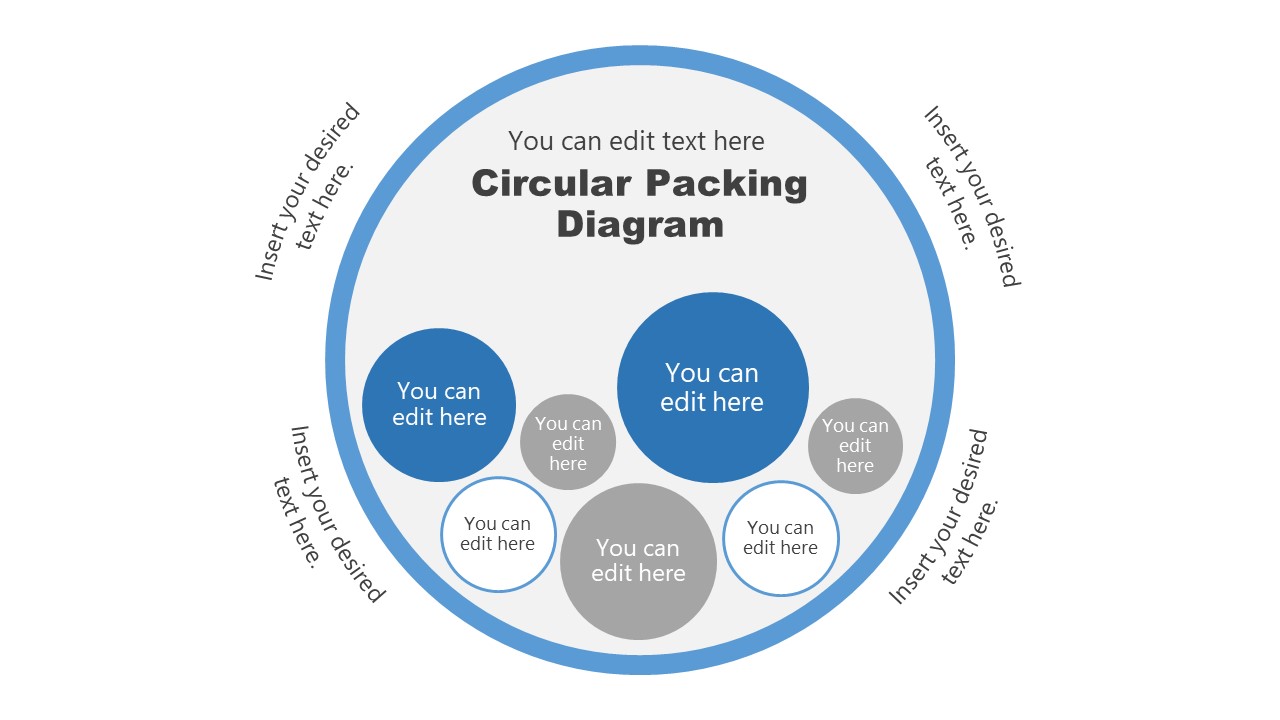
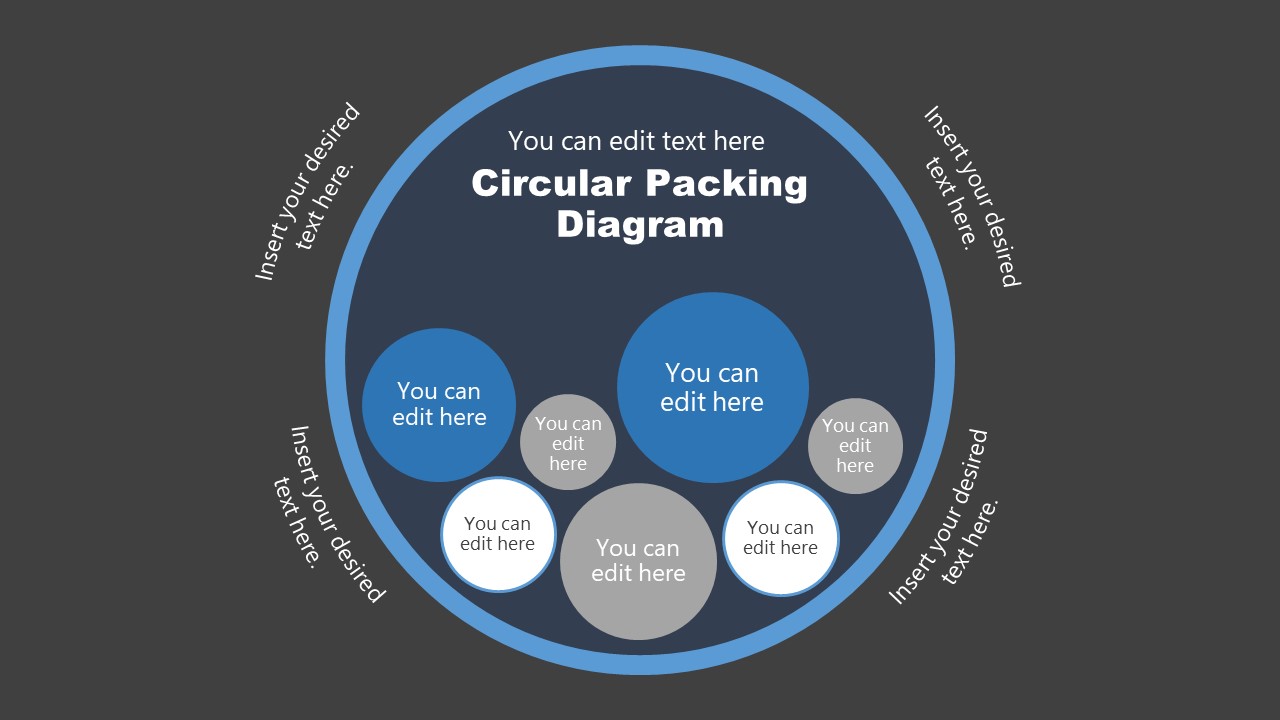
The Circular Packing Diagram PowerPoint Template presents two slides of bubble diagram designs. A bubble chart is similar to the XY scatter graph chart where plotted points are expressed as bubbles instead of dots. These bubbles are present in different sizes, which help visualize the magnitude or impact of variables. The packed bubble chart, however, visualizes data in a compact format. Therefore, it is a convenient way of presenting a large amount of data in one place. Since the position of bubbles is not significant in such circular packing diagrams.
The PowerPoint templates of the packed bubble diagram show several inner circles within one group. Users can multiply these circles, drag them around, and customize their size according to relevant data values. The editable PowerPoint of circular packing diagram provides flexibility to customize the template design. For example, changing color fill or outline to demonstrate different subgroups.
The Circular Packing Diagram PowerPoint Template is used to display data in a circle cluster. It is ideal for displaying the impact of an activity or different statistics. These diagram templates are often used in presentations about the global economy or business surveys. One example is annual economic growth worldwide by showcasing names and earnings in circles. Users can resize circles according to turnover by country. Likewise, on a smaller scale, the bubble diagram template can be used to display the impact of a company’s marketing efforts on various channels.
