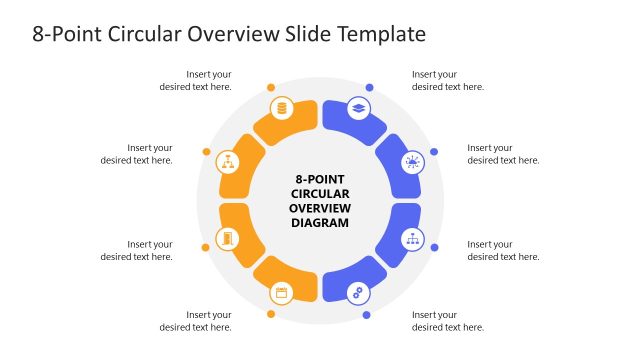
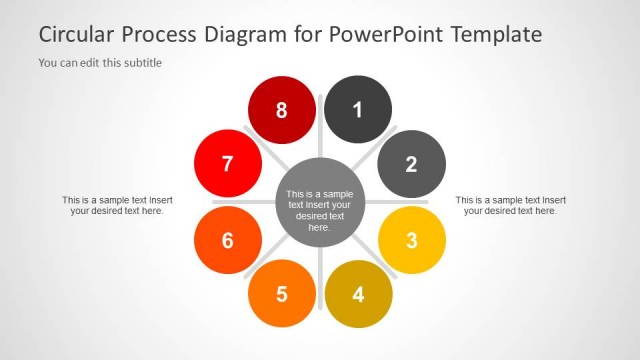
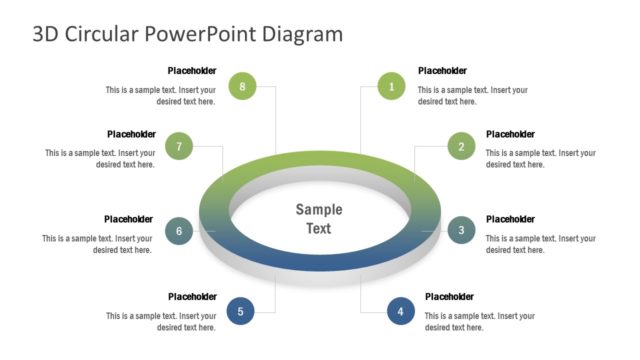
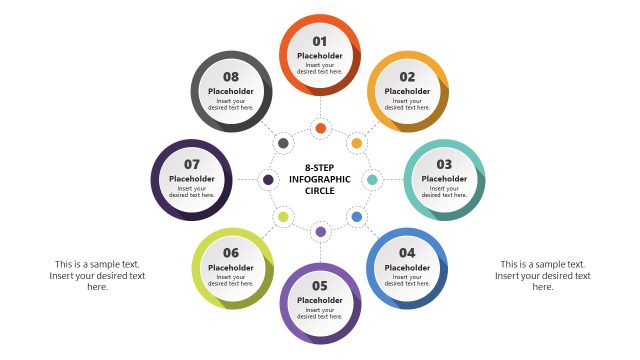
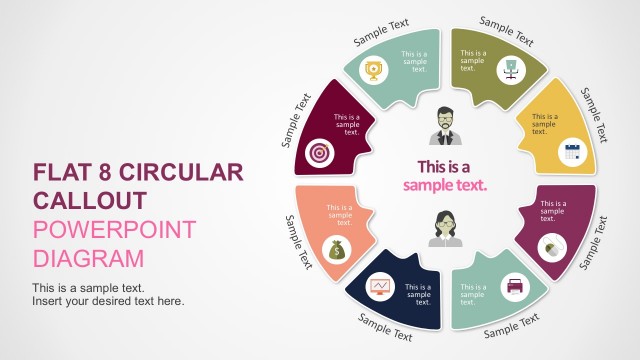
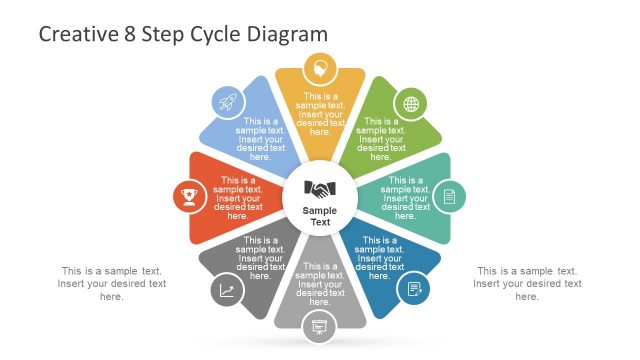
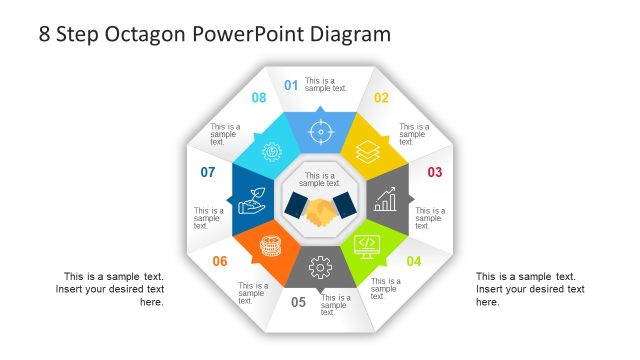
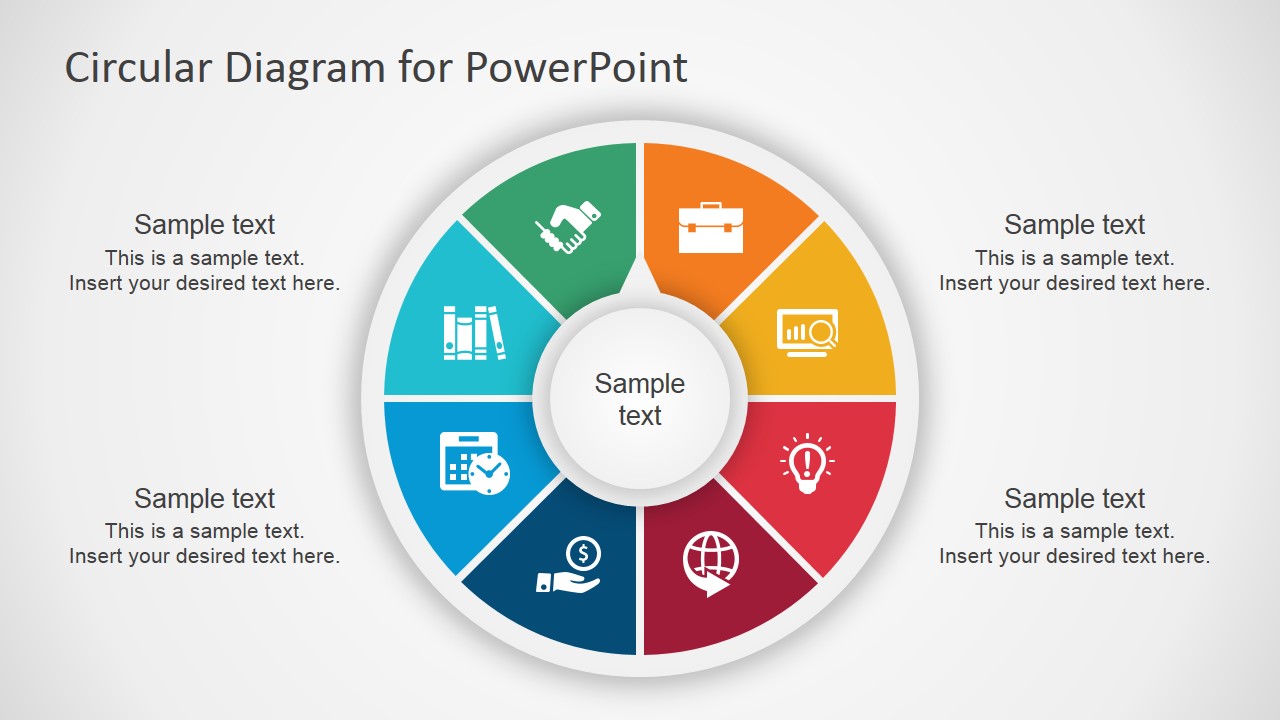
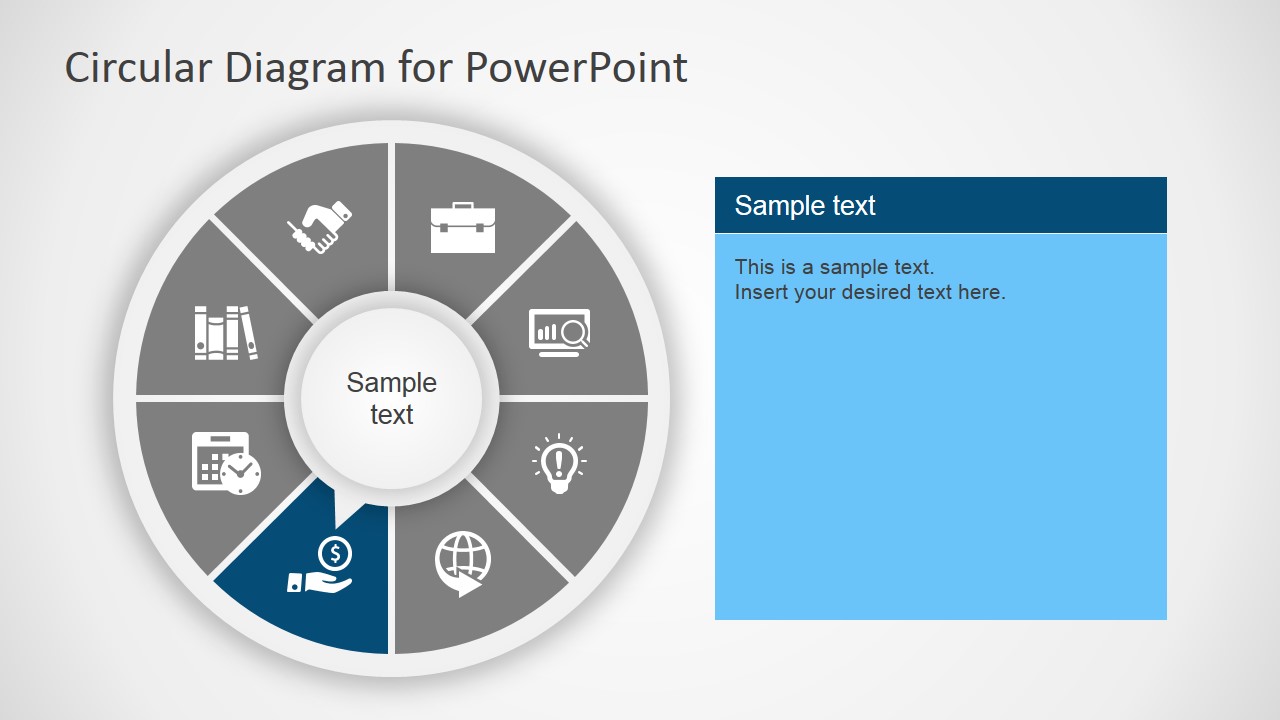
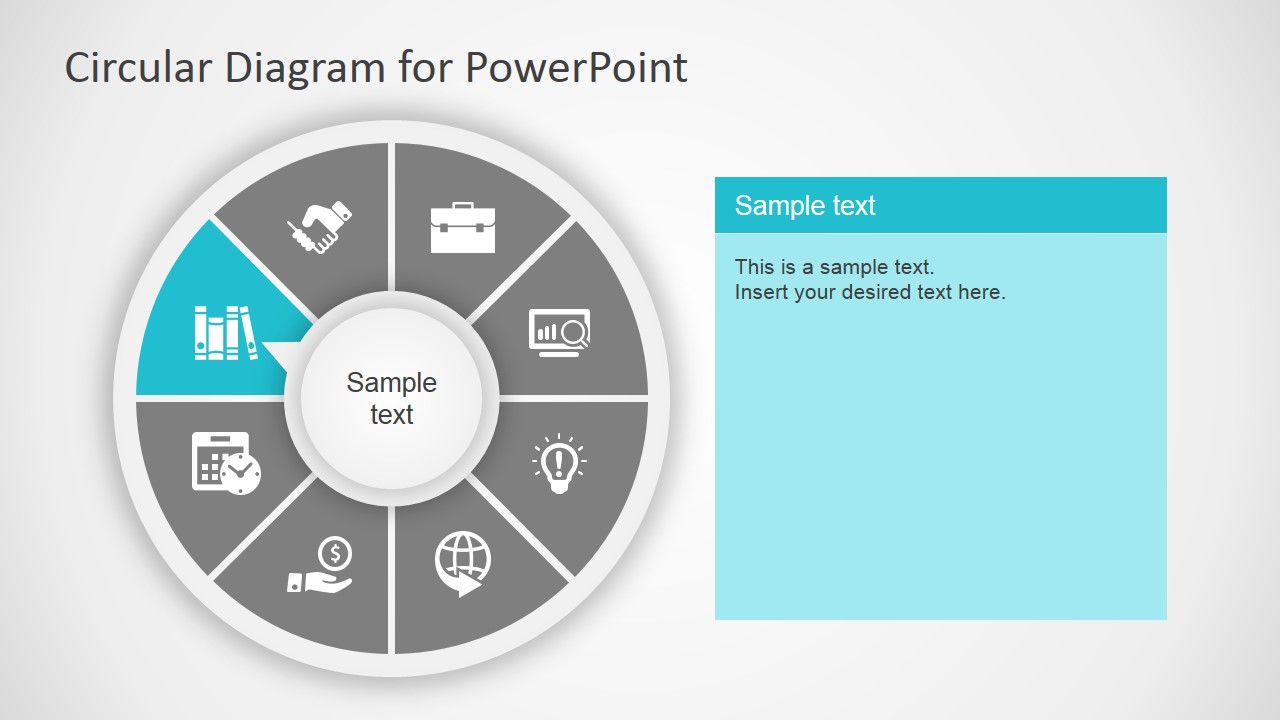
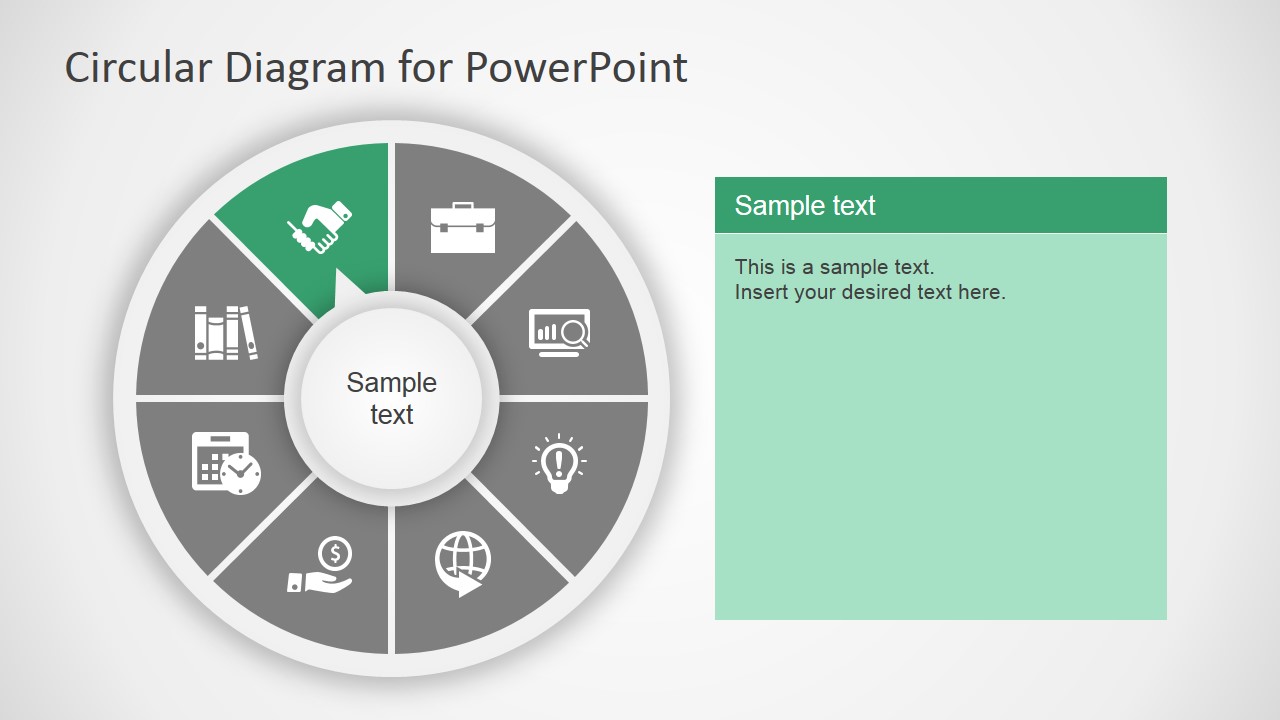
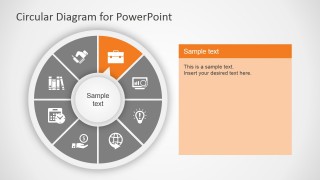
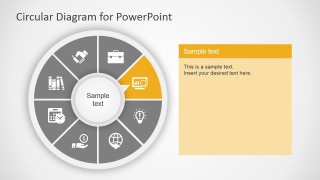
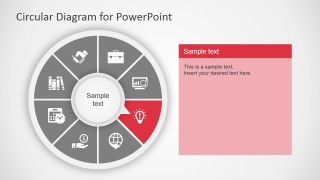
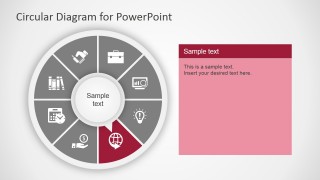
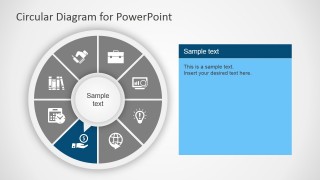
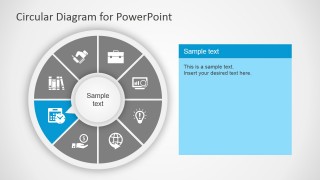
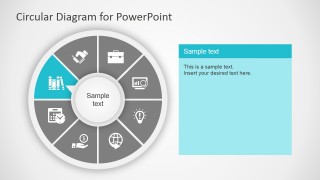
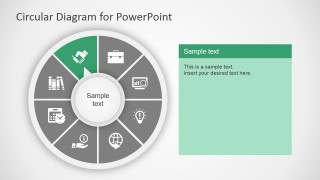
This circular diagram template for presentations contains a creative illustration of a diagram design that you can use to present a circular or cycle business process during a PowerPoint presentation. The circular diagram design with 8 steps can also be used to make infographics in PowerPoint and it includes editable presentation icons that you can easily customize based on your presentation content and topic.
Aside from this 8-step diagram design, you can also download this 6-step circular PPT template variant, or alternatively, download other circular diagram templates for PowerPoint & Google Slides presentations.
What’s inside this template
Example presentation scenarios
- A consultant can use the full circular overview to introduce an 8-step operating model before discussing each stage with the highlighted step slides.
- A project manager can present a recurring workflow by assigning each icon segment to a phase and using the right-side explanation panels for responsibilities or deliverables.
- A trainer can teach a repeatable business process by starting with the colorful cycle and then moving through the individual highlighted segments one at a time.
- An operations leader can explain a service cycle to executives by pairing the circular process diagram with concise stage descriptions in the large text boxes.
Features
- 100% editable presentation template
- Compatible with Microsoft PowerPoint and Google Slides
- Scalable vector shapes, icons and illustrations
- AI-Ready for Microsoft Copilot and Claude
- Instant access and download
Frequently asked questions
Q: How should I present the eight steps without overwhelming the audience?
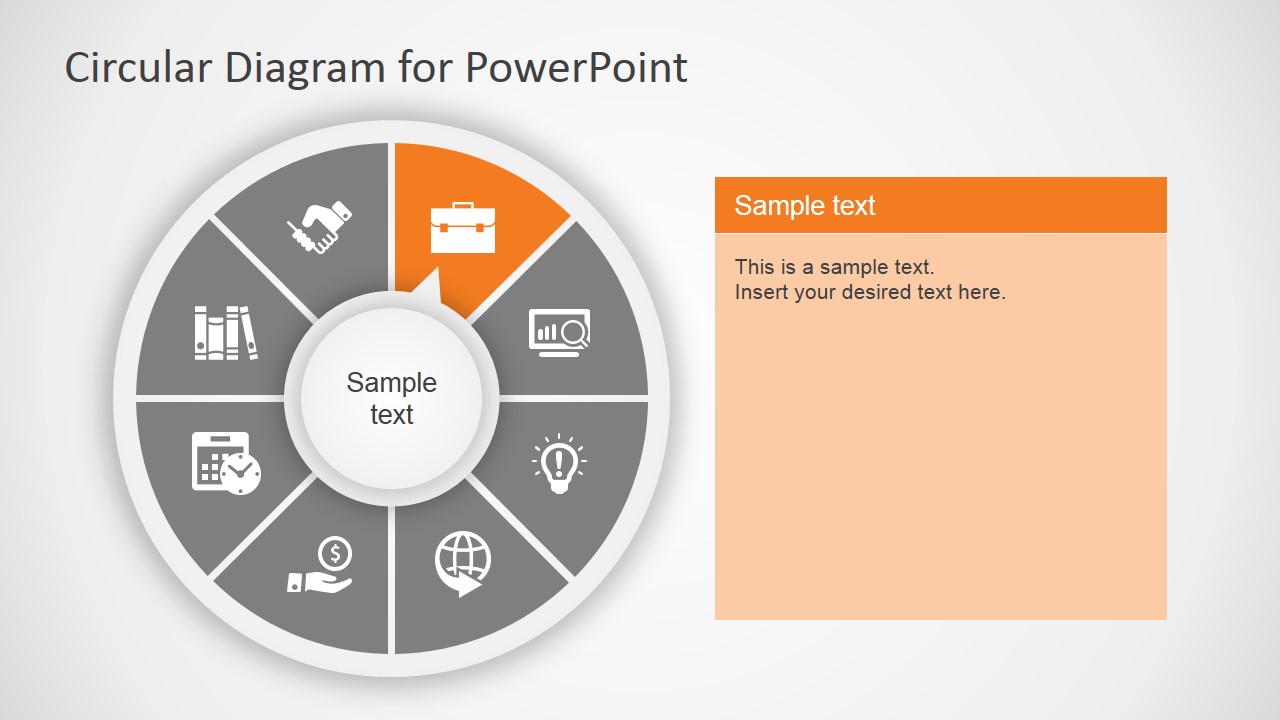
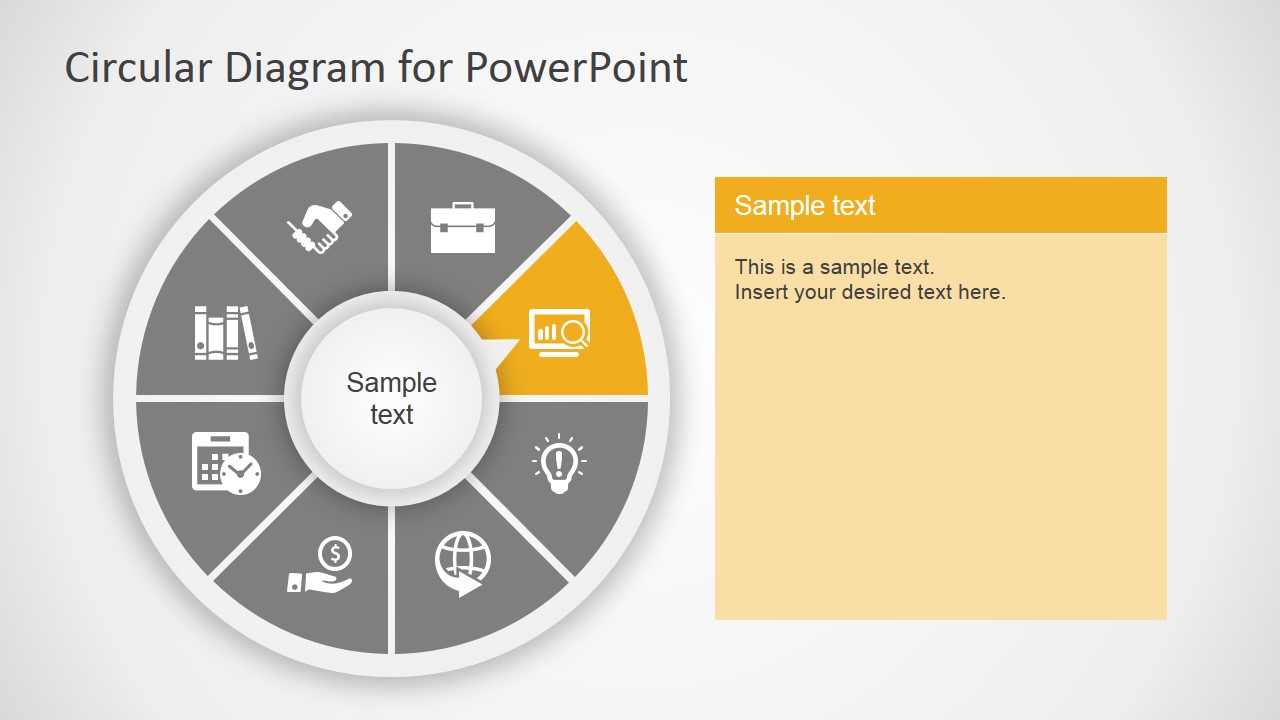
A: Start with the full-color overview slide to give the audience the complete process shape. Then move through the single-step highlight slides and explain only one segment at a time. Keep the right-side panel to a short label, one key point, and one implication so the circular diagram remains the main visual anchor.
Q: What business situations fit this circular diagram best?
A: This template works best when the process repeats, feeds back into itself, or depends on balanced stages. Consultants, trainers, and operations managers can use it for service cycles, governance models, customer journey loops, or internal workflows where each stage is distinct but part of one continuous system.
Q: Why use a circular metaphor instead of a linear process diagram?
A: The circular metaphor signals continuity, iteration, and connected steps more clearly than a straight line. In this design, the gray inactive segments keep the whole system visible while one colored segment directs attention. That structure helps audiences understand both the individual stage and its relationship to the larger cycle.



8-Step Circular Diagram PowerPoint Template
9-slide presentation template for 8-step circular process diagrams and business cycle infographics
The 8-Step Circular Diagram PowerPoint Template is a 9-slide diagram deck for showing an eight-part cycle or process. It includes a full circular overview, individual step highlight slides, icon segments, and right-side explanation panels. It is built for business presenters using Microsoft PowerPoint or Google Slides.


 Loading...
 Microsoft PowerPoint
  Microsoft Copilot
  Claude for PowerPoint
 Other formats supported
Subscribe today and get immediate
access to download our PowerPoint templates.