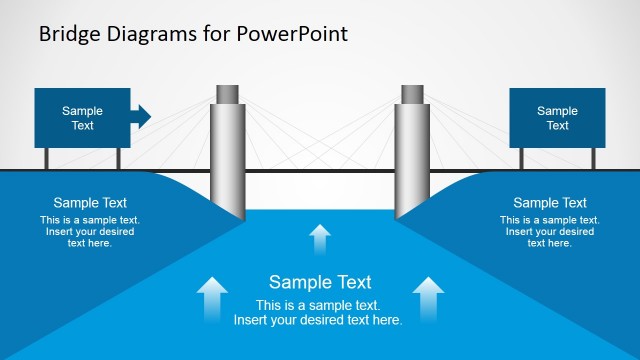
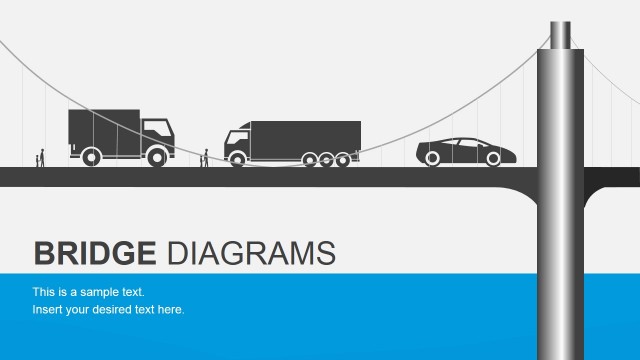
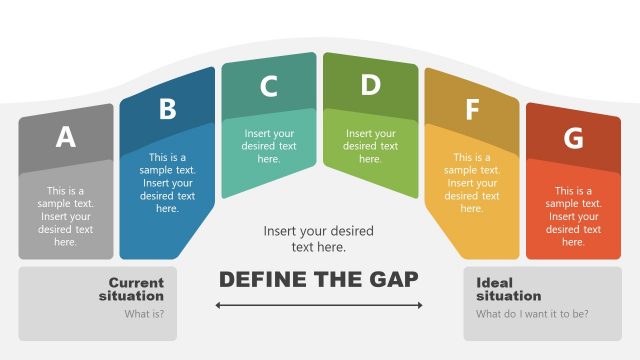
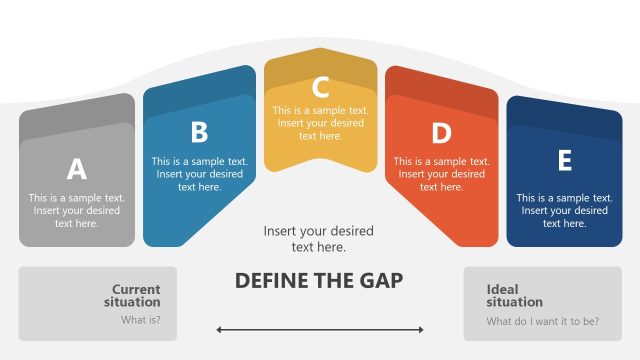
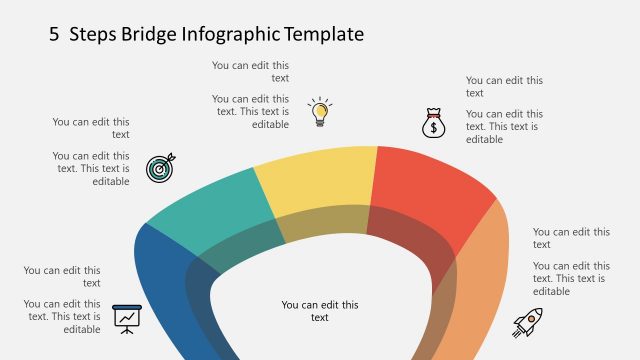
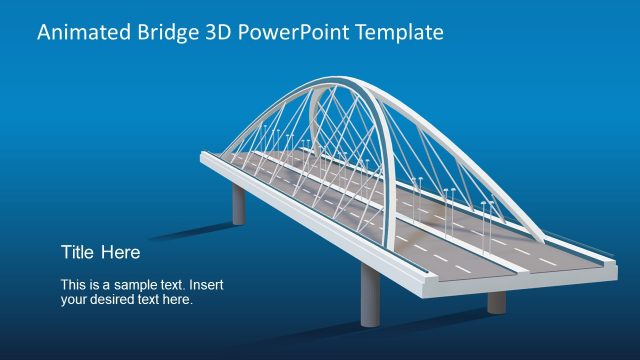
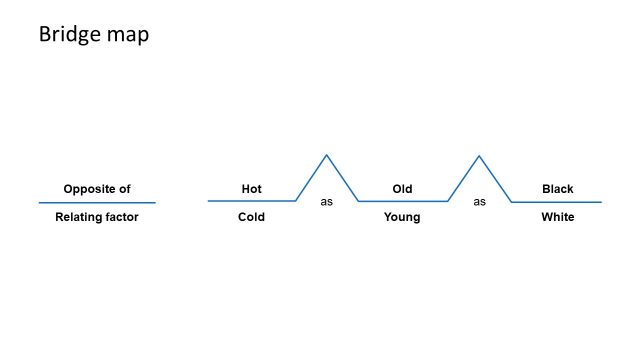
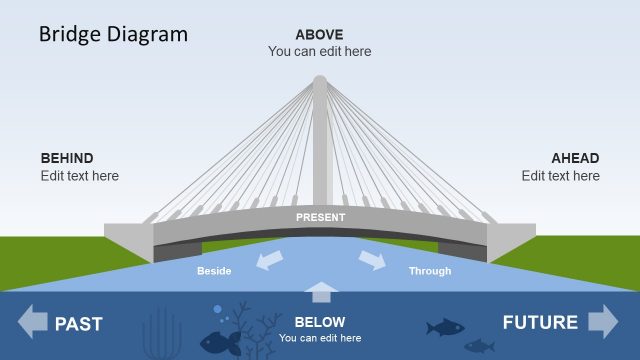
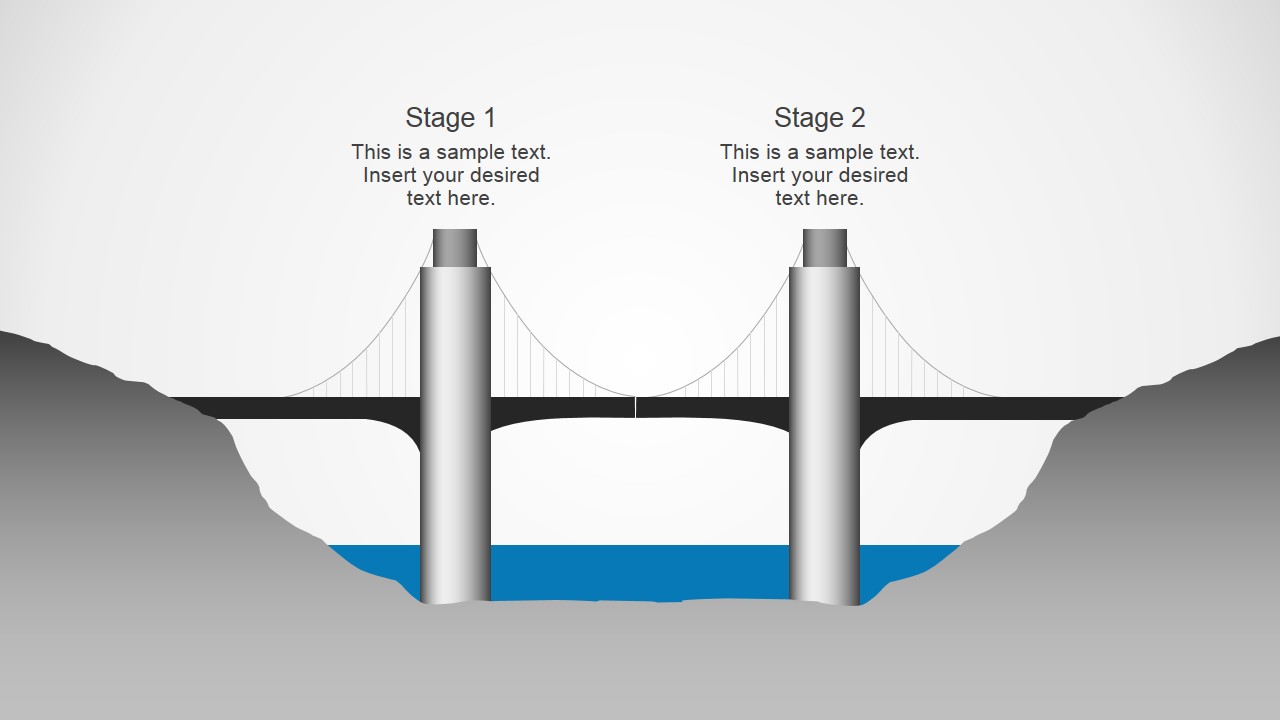
2D Chain Bridge diagrams for PowerPoint contains eleven PowerPoint slide designs with a suspension bridge bridge metaphor that you can use in your presentations to represent many different scenarios such as describing a risky process, a transition with multiple stages or when there is no plan to go from A situation to situation B.
What’s inside this template
Example presentation scenarios
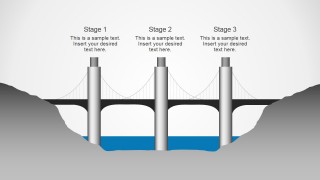
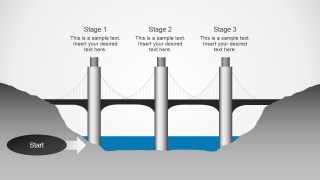
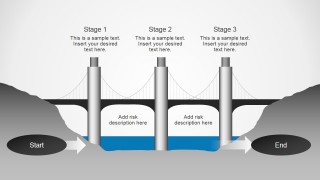
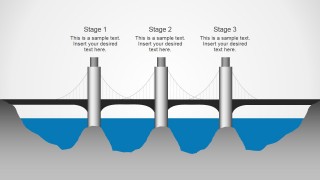
- A project manager can explain how a team moves from kickoff to completion by using the three-stage start-to-end bridge with risk callouts to identify where progress may slow down.
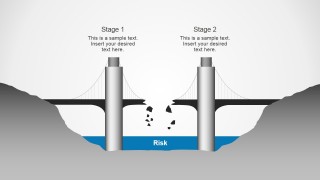
- A risk manager can present an unresolved exposure by using the broken bridge gap and debris layout to show where the plan fails and why mitigation is needed.
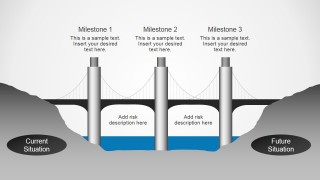
- A change management consultant can compare the current situation with the future situation by using the milestone bridge slide with risk descriptions between the two states.
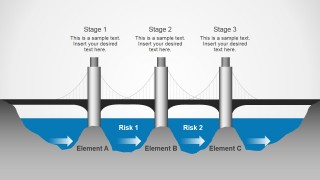
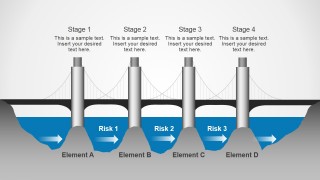
- A strategy presenter can map dependencies by using the element and risk process bridge to connect Element A through Element D with the risks that appear between them.
Features
- 100% editable presentation template
- Compatible with Microsoft PowerPoint and Google Slides
- 16:9 aspect ratio slides
- Scalable vector shapes, icons and illustrations
- AI-Ready for Microsoft Copilot and Claude
- Instant access and download
Frequently asked questions
Q: How should a presenter structure a message with the chain bridge metaphor?
A: Start by naming the gap the audience already recognizes, then introduce each bridge tower as a stage or decision point. Use the risk callouts only for the issues that could stop movement across the bridge. End with the destination state so the audience sees both the danger and the intended crossing.
Q: Who is this template best suited for?
A: This template fits presenters who need to explain movement through uncertainty, such as project leaders, change managers, consultants, or risk teams. It works well when the audience must understand dependencies, failure points, and a target state before approving a plan, funding, mitigation action, or phased implementation.
Q: Why does a bridge diagram help communicate risk and transition?
A: A bridge is a clear visual metaphor for crossing from one condition to another. The complete bridge layouts show a credible path, while the broken bridge layouts make risk visible as an interruption. This contrast helps an audience separate progress stages from the obstacles that threaten movement.


Chain Bridge PowerPoint Diagrams
11-slide presentation template for chain bridge diagrams, risk gaps, and staged transition plans
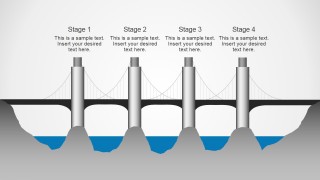
Chain Bridge PowerPoint Diagrams is an 11-slide diagram template for Microsoft PowerPoint and Google Slides. It uses a suspension bridge over water to show staged transitions, risk gaps, start-to-end movement, current-to-future states, and element-to-risk process paths. It suits project, change, strategy, and risk management presentations.
- Category
- Diagrams
- Rating


 Loading...
- Aspect ratio
- 16:9
- Item ID
- 6917-03
- Colors
 Microsoft PowerPoint
  Microsoft Copilot
  Claude for PowerPoint
 Other formats supported
Subscribe today and get immediate
access to download our PowerPoint templates.