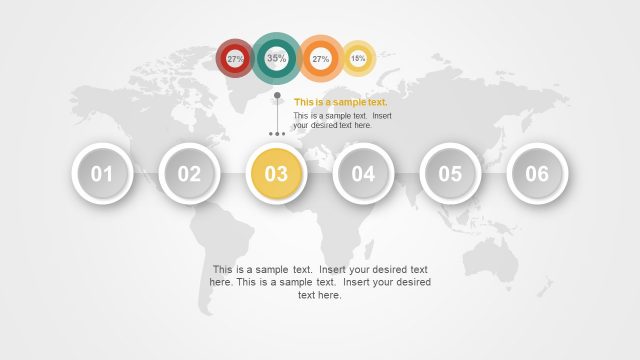
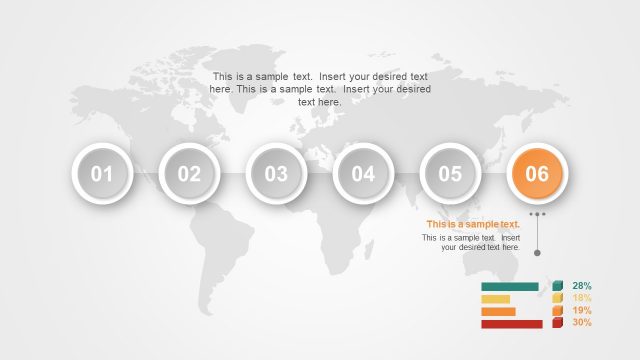
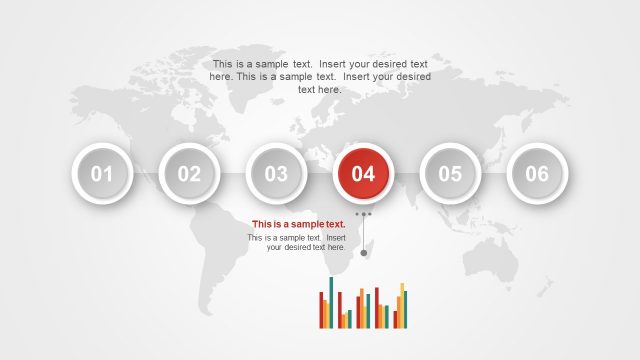
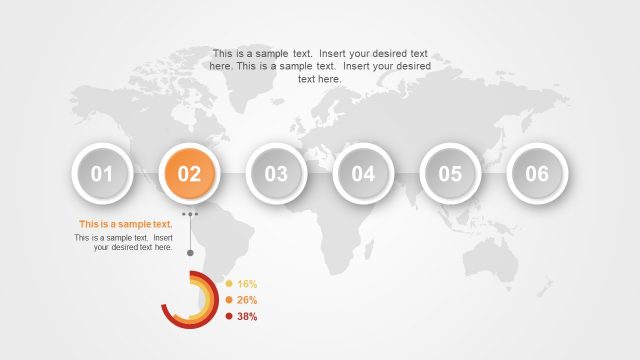
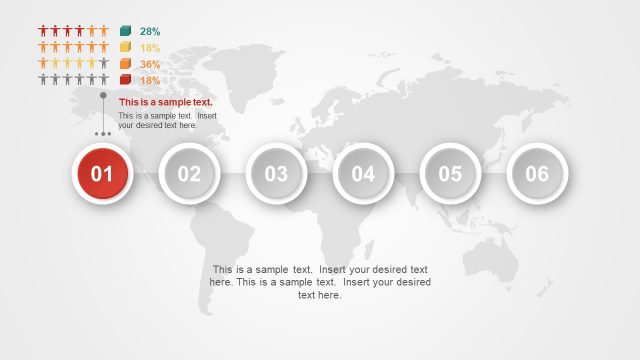
Stacked Area PowerPoint Chart
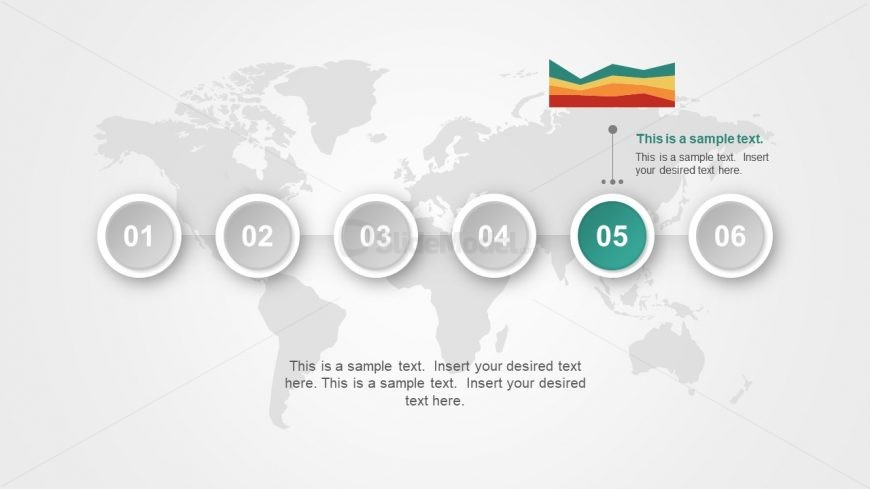
The Stacked Area PowerPoint Chart in dashboard timeline PowerPoint of material design is a data driven graph. The PowerPoint shows a stack area data driven chart as the representation of phase. The slide has animation for an interactive view and audience engagement. The PowerPoint is an editable presentation of creative infographic elements. The users can modify the data driven charts by altering the colors from plus symbol button. Similarly, change the data values, add or delete the stack bars from funnel shape button. The users can add text placeholders and make changes in font and size.
Return to Timeline Template Material PowerPoint.