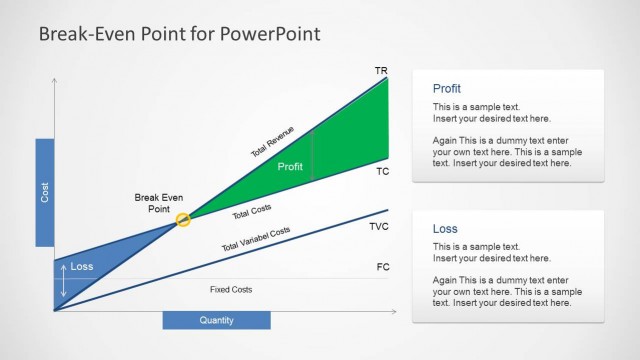
Slide 5 of 7 from Break-Even Point Curves for PowerPoint
6120-break-even-curve-5
Marginal Cost Relationship Diagram for Analysis
- Diagram
- Other
- Concept Explanation Slide
- 16:9
- 100% Editable
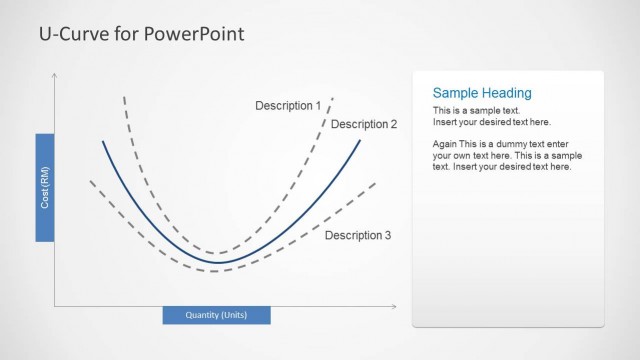
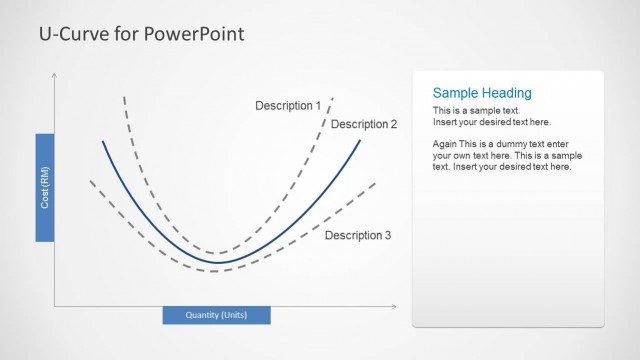
The Relationship Between Marginal Cost slide from the Break-Even Point Curves for PowerPoint template presents a clear diagram illustrating cost behavior with editable slides ideal for economic analysis and pricing strategy discussions. This slide layout includes vector icons and curves representing marginal, average, and average variable costs, supporting detailed explanations in business presentations or corporate slide decks.
What’s on This Slide
The layout features a graph with two axes, where the vertical axis represents cost (RM) and the horizontal axis represents quantity (units). Three curves are plotted: marginal cost (MC), average cost (AC), and average variable cost (AVC). The MC curve is positioned above the AC and AVC curves, which are both curved lines. Text placeholders are located on the right side, including a sample heading and two body text areas. The background is light, providing contrast to the blue curves and text elements.
How to Use It
This diagram serves to illustrate the relationship between marginal cost, average cost, and average variable cost in economic analysis. It fits well in a presentation discussing cost structures or pricing strategies. This layout is useful for finance teams, educators, and analysts when explaining how costs behave as production levels change. It can be used in discussions about cost efficiency and pricing strategies in various business contexts.
Text Placeholders & Capacity
Keep your copy within these limits so it fits without resizing. Body slots can accommodate roughly 20-30 words each.
| Placeholder | Count | Max characters (approx.) |
|---|---|---|
| Slide title | 1 | 30 |
| Body paragraph | 2 | 150 |
Slide Keywords
Download unlimited PowerPoint templates, charts and graphics for your presentations with our annual plan.
DOWNLOADReturn to Break-Even Point Curves for PowerPoint.