Slide 4 of 7 from Break-Even Point Curves for PowerPoint
Service Cost Relationship PPT Slide Design
Service/Cost Relationship Diagram for Analysis
- Diagram
- Other
- Concept Explanation Slide
- 16:9
- 100% Editable
The Service/Cost Relationship Diagram slide from the Break-Even Point Curves for PowerPoint template offers a clear visual tool for analyzing cost structures and service quality. Ideal for business presentations and financial forecasting, this slide uses editable shapes and vector icons to illustrate key concepts such as conformance and operating points, enhancing operational efficiency reviews within corporate presentation slide decks.
About This Slide
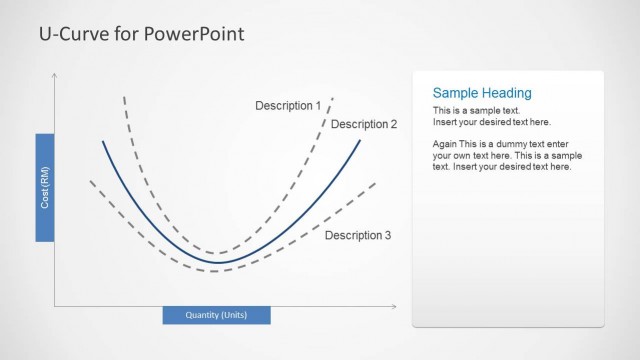
Service Cost Relationship PPT slide design showing total cost, acceptable cost range, operating and service failure curves for PowerPoint presentations.
What’s on This Slide
The slide features a diagram illustrating the service/cost relationship. It includes a curved line representing total cost, with a shaded area labeled 'Acceptable Range' positioned above it. The x-axis is labeled 'Conformance' and the y-axis 'Cost.' Two additional lines indicate 'Service Failure' and 'Operating' points. Text placeholders are present in the upper right corner, aligned vertically, for a heading and body text. The overall layout is clean, with a light background and clear visual hierarchy emphasizing the diagram.
How to Use It
This layout serves as a visual representation of the service/cost relationship, useful in economic analysis or business presentations. It fits well in a sequence discussing cost structures or operational efficiency. This slide can be applied in scenarios such as financial forecasting, cost management discussions, or service quality assessments. It effectively conveys complex relationships in a straightforward manner, making it suitable for analysts and educators.
Text Placeholders & Capacity
Keep your copy within these limits so it fits without resizing. Text slots are moderate, roughly 5-10 words each.
| Placeholder | Count | Max characters (approx.) |
|---|---|---|
| Slide title | 1 | 30 |
| Item heading | 2 | 15 |
| Item body | 2 | 50 |
Slide Keywords
Download unlimited PowerPoint templates, charts and graphics for your presentations with our annual plan.
DOWNLOADReturn to Break-Even Point Curves for PowerPoint.