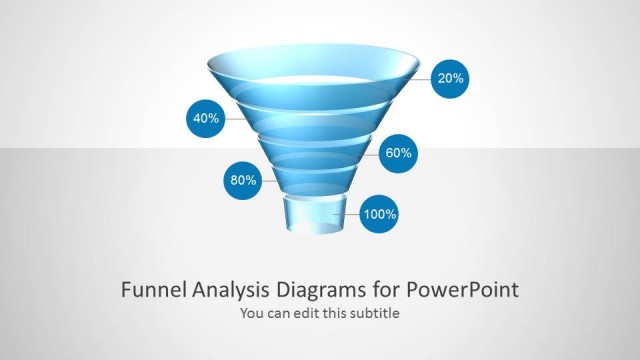
Slide 4 of 4 from Blue Funnel Analysis Diagrams for PowerPoint
6087-02-funnel-analysis-diagrams-4
Funnel Analysis Diagram for Presentations
- Diagram
- Funnel
- Process Slide
- 16:9
- 100% Editable
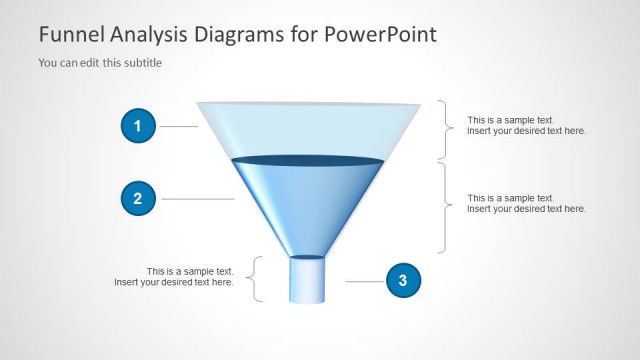
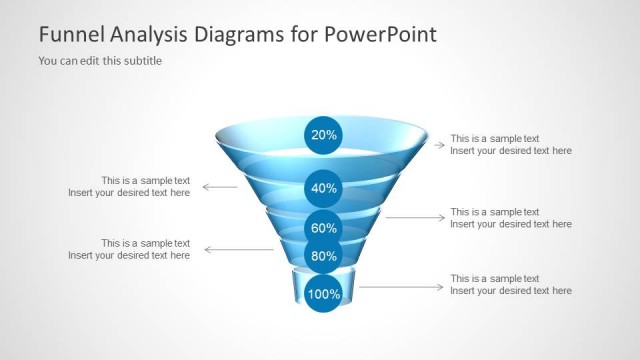
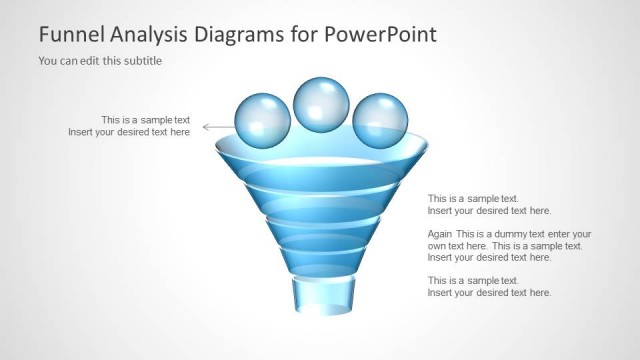
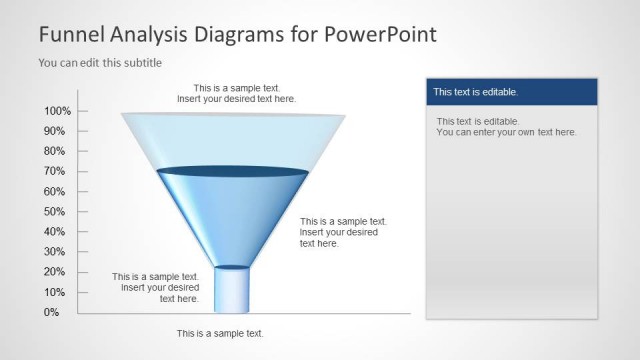
The Funnel Analysis Diagram slide from the Blue Funnel Analysis Diagrams for PowerPoint template offers a clear visual of sales funnel stages, ideal for marketing strategy discussions and customer journey mapping. This slide layout uses editable shapes and vector icons to illustrate process flow effectively in business presentations or pitch deck templates.
What’s on This Slide
The slide features a funnel diagram oriented to the right, with a gradient blue color scheme. It includes five circular nodes on the left side, each with a placeholder for text. The funnel narrows towards the right, leading to a larger circular node at the end, which also contains a text placeholder. The title is positioned at the top left, with a subtitle directly below it. The background is light, enhancing the visibility of the funnel and nodes. The overall layout emphasizes a clear flow from the left to the right.
How to Use It
This layout serves as a visual representation of a funnel analysis, ideal for illustrating stages in a sales or marketing process. It fits well in a presentation sequence following problem identification and before discussing solutions or strategies. This structure is useful for marketers and sales teams to depict customer journey stages or conversion rates. It can be used to highlight key metrics at each stage of the funnel, making it effective for reports and strategy discussions.
Text Placeholders & Capacity
Keep your copy within these limits so it fits without resizing. Node text slots can accommodate around 40 characters each.
| Placeholder | Count | Max characters (approx.) |
|---|---|---|
| Slide title | 1 | 30 |
| Subtitle | 1 | 30 |
| Item body | 5 | 40 |
| Item body | 1 | 40 |
Slide Keywords
Download unlimited PowerPoint templates, charts and graphics for your presentations with our annual plan.
DOWNLOADReturn to Blue Funnel Analysis Diagrams for PowerPoint.