Slide 3 of 4 from Funnel Diagram for PowerPoint
Funnel Analysis Diagram Design for PowerPoint
Funnel Analysis Diagram for Presentations
- Diagram
- Funnel
- Process Slide
- 16:9
- 100% Editable
The Funnel Analysis Diagram slide from the Funnel Diagram for PowerPoint template offers a professional layout for visualizing marketing analysis and sales funnel stages. This slide template includes editable shapes and placeholders designed to map customer journeys clearly, making it suitable for business presentations and pitch deck templates focused on conversion metrics and process visualization.
About This Slide
This Office template contains a Funnel Analysis Diagram Design for PowerPoint. It can be used as a sales funnel or a PowerPoint presentation template with a funnel diagram. The funnel can represent the filtering of information through a series of standardized tests.
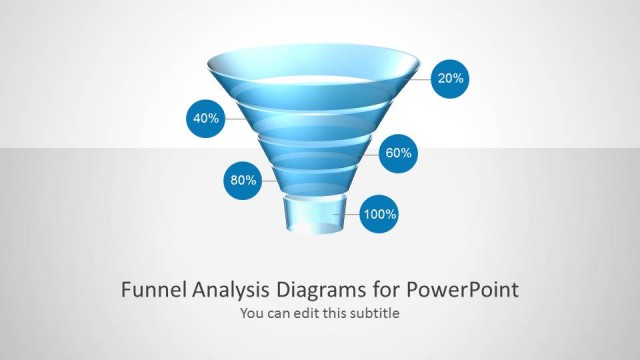
The center of the slide design contains a 3D segmented funnel that appears to be made of a transparent, synthetic material like plastic. Three 3D balls are located right above the funnel. Two text placeholders can be found on the slide for discussions. The images on display have been created from composite arrangements of PowerPoint objects that can be rearranged to suit the presenter’s specifications. Any modifications, even to size, will not affect its graphic resolution.
What’s on This Slide
The slide features a funnel diagram with a three-dimensional design, oriented vertically. At the top, three circular nodes are positioned, each containing a placeholder for text. Below the nodes, the funnel narrows downwards, with multiple text placeholders arranged vertically on the right side. The placeholders are aligned to the right and are visually distinct from the funnel graphic. The background is light, enhancing the funnel's glossy blue color scheme. The overall composition emphasizes the funnel shape, with a clear visual hierarchy between the nodes and text areas.
How to Use It
This layout serves as a funnel analysis diagram, ideal for illustrating stages in a process or conversion metrics. It fits well in a presentation sequence after introducing a problem or opportunity, leading into detailed analysis. This structure is useful for marketing or sales presentations, where visualizing customer journey stages or sales processes is essential. It can also be adapted for various business scenarios requiring a clear representation of input and output metrics.
Text Placeholders & Capacity
Keep your copy within these limits so it fits without resizing. Node body slots can hold roughly 10-12 words each.
| Placeholder | Count | Max characters (approx.) |
|---|---|---|
| Slide title | 1 | 30 |
| Subtitle | 1 | 30 |
| Item body | 3 | 50 |
| Body paragraph | 4 | 100 |
Slide Keywords
Download unlimited PowerPoint templates, charts and graphics for your presentations with our annual plan.
DOWNLOADReturn to Funnel Diagram for PowerPoint.