Slide 4 of 4 from Blue Dashboard Template for PowerPoint
9057-clean-dashboard-powerpoint-0002-4
KPI Dashboard Slide for Business Reporting
- Chart
- Dashboard Composite
- Financial Summary Slide
- 16:9
- 100% Editable
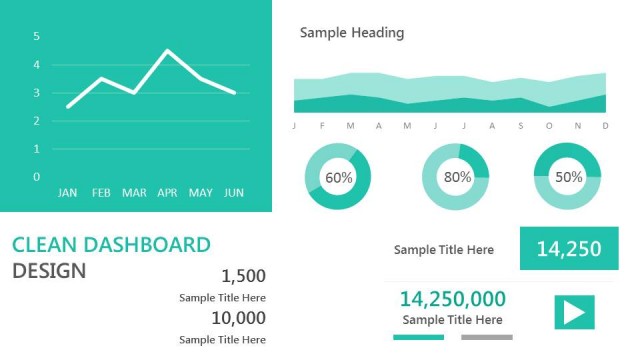
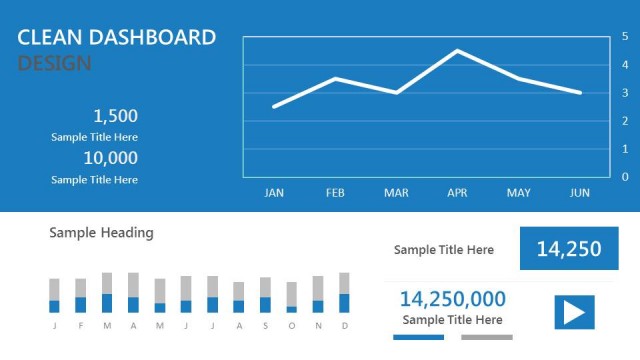
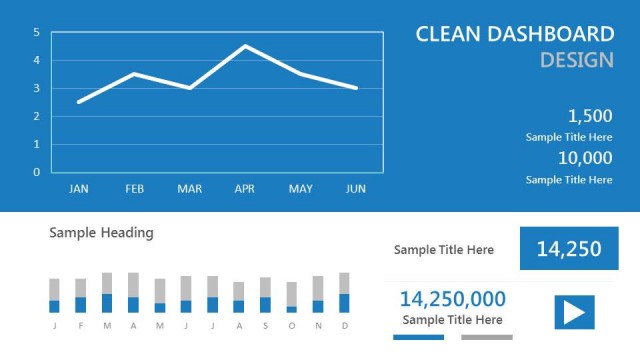
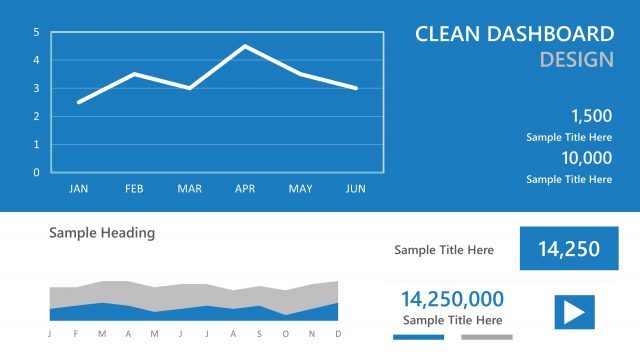
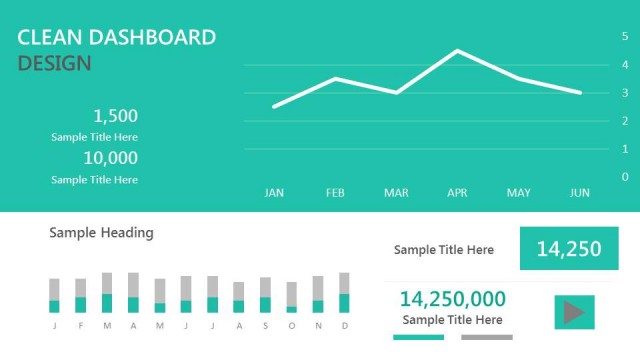
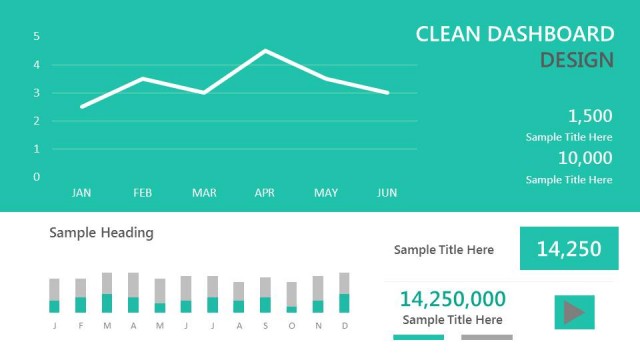
The KPI Dashboard with Charts slide from the Blue Dashboard Template for PowerPoint offers a structured layout for presenting key performance indicators through line and area charts alongside circular gauge indicators. This slide template supports business presentation needs such as quarterly summaries and performance reviews, making it a practical choice for corporate presentations that require clear visualization of financial summaries using editable slides and vector icons.
What’s on This Slide
The layout features a line chart on the left, displaying data trends over six months. To the right, a horizontal area chart shows monthly performance with labeled months. Below the charts, there are three circular gauge indicators representing percentages, each with a distinct color. Text placeholders are positioned beneath the gauges for titles and values, with a larger title at the top left. The overall color scheme includes shades of blue, with a white background enhancing clarity and focus on the data.
How to Use It
This layout serves as a KPI dashboard to present key performance indicators visually. It fits well at the end of a presentation to summarize performance metrics. Ideal for business reviews, it allows managers to convey data insights clearly. This layout can also be used in quarterly reports or strategy meetings where performance tracking is essential. It provides a structured way to display multiple data points simultaneously, making it effective for decision-making discussions.
Text Placeholders & Capacity
Keep your copy within these limits so it fits without resizing. Body slots can hold around 2-3 words each.
| Placeholder | Count | Max characters (approx.) |
|---|---|---|
| Chart title | 1 | 20 |
| Item heading | 3 | 10 |
| Item body | 3 | 10 |
| Body paragraph | 3 | 15 |
| Slide title | 1 | 30 |
Slide Keywords
Download unlimited PowerPoint templates, charts and graphics for your presentations with our annual plan.
DOWNLOADReturn to Blue Dashboard Template for PowerPoint.