Slide 4 of 4 from Clean Dashboard Template for PowerPoint
Clean Dashboard Example Slide Design for PowerPoint
Data Dashboard with Charts and KPIs
- Chart
- Line Chart
- Data Summary Slide
- 16:9
- 100% Editable
About This Slide
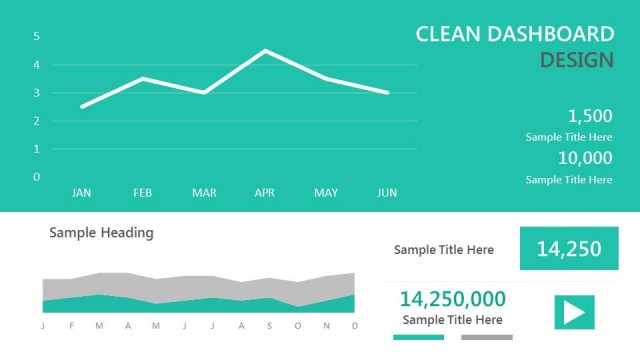
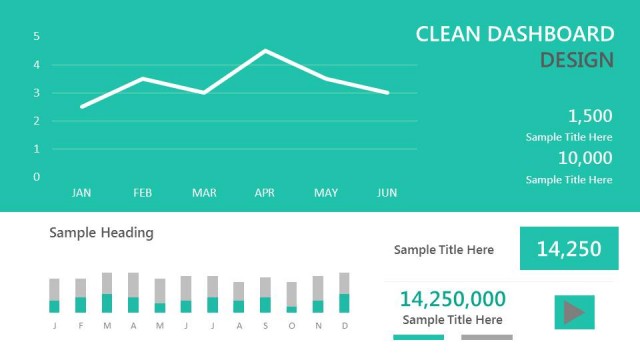
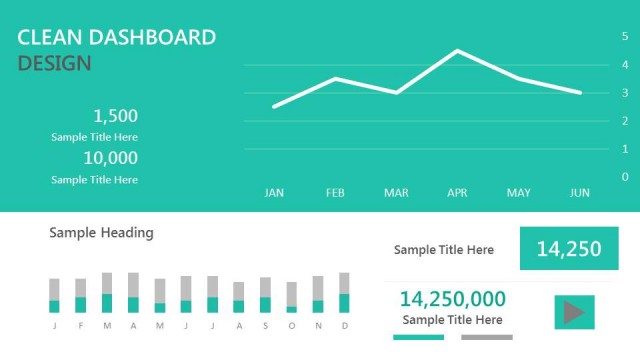
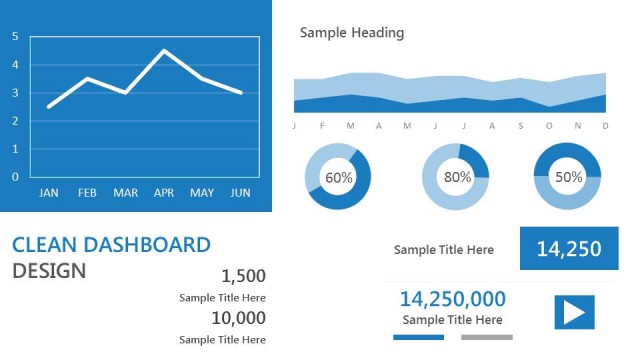
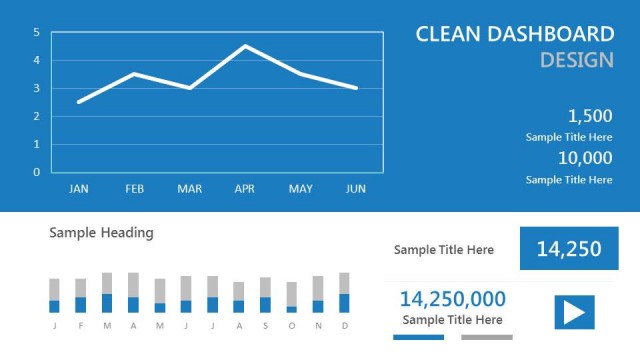
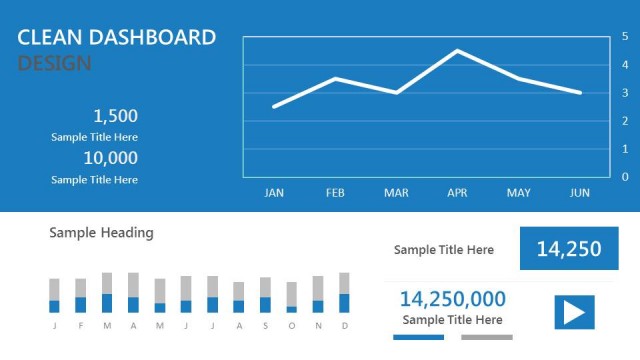
Clean dashboard example slide design for PowerPoint presentations with a clean design and components to display line chart, area chart and KPI values with circular donut charts. You can also enter sales totals and revenue in the text box.
What’s on This Slide
The layout features a line chart positioned on the left, displaying monthly data from January to June. To the right, a horizontal area chart shows a trend across months. Below the charts, three circular KPI indicators represent percentages, aligned horizontally. A numeric card displays a value of 14,250, with a subtitle underneath. The background is a light teal color, and the overall composition is structured with a clear visual hierarchy, emphasizing the charts and KPIs. Text placeholders exist for titles and subtitles, aligned to maintain balance.
How to Use It
This layout serves as a comprehensive data dashboard, ideal for presenting performance metrics and trends. It fits well in a presentation sequence after problem identification slides, providing a visual summary of key performance indicators. This structure is suitable for business analysts or managers reporting on quarterly performance, sales data, or project progress. It effectively communicates complex data in an easily digestible format, making it useful for executive briefings or team updates.
Text Placeholders & Capacity
Keep your copy within these limits so it fits without resizing. Body slots can hold about 2-3 words each.
| Placeholder | Count | Max characters (approx.) |
|---|---|---|
| Slide title | 1 | 30 |
| Item body | 3 | 10 |
| Item heading | 3 | 5 |
| Body paragraph | 1 | 30 |
Slide Keywords
Download unlimited PowerPoint templates, charts and graphics for your presentations with our annual plan.
DOWNLOADReturn to Clean Dashboard Template for PowerPoint.