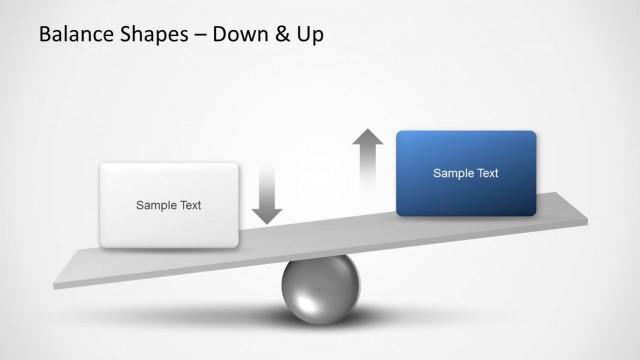
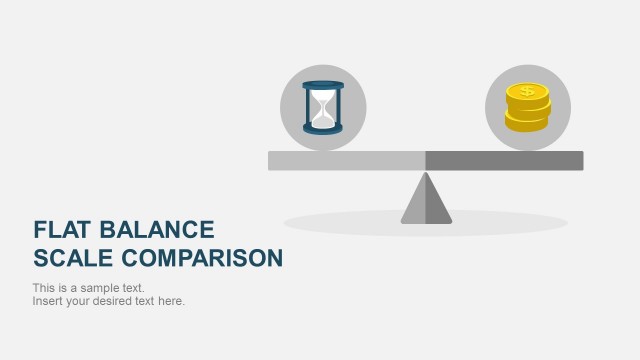
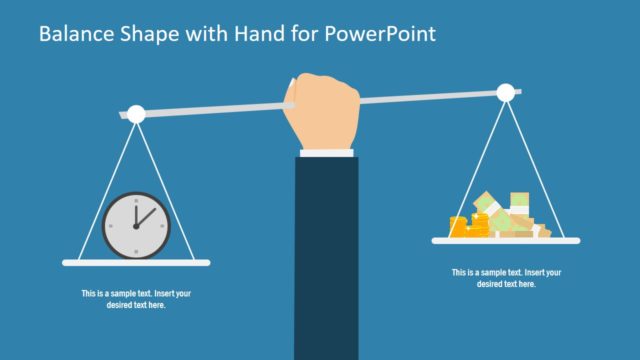
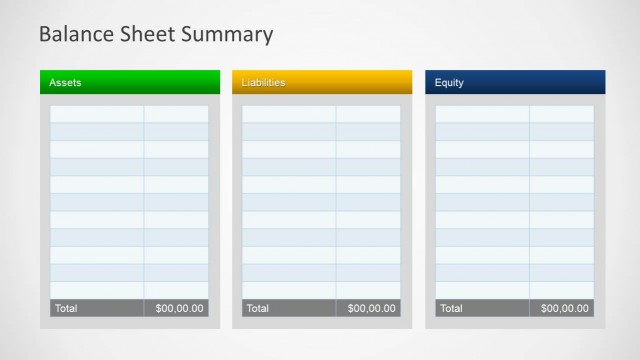
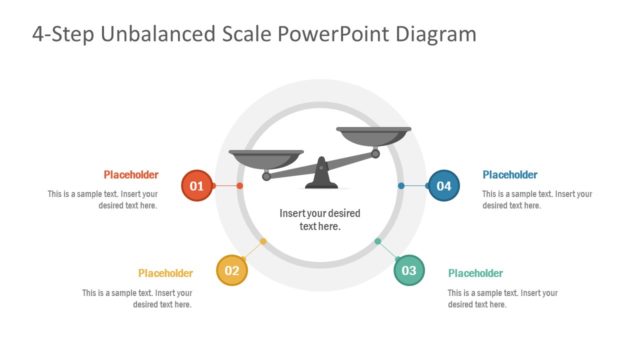
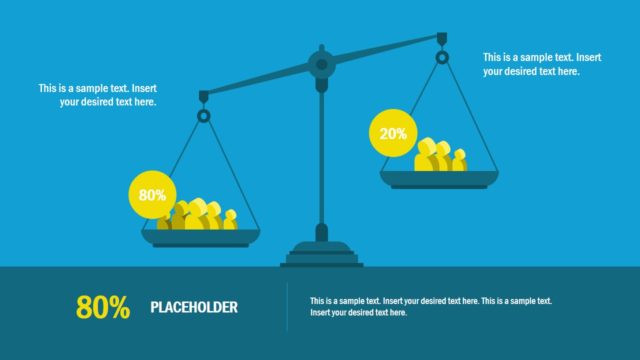
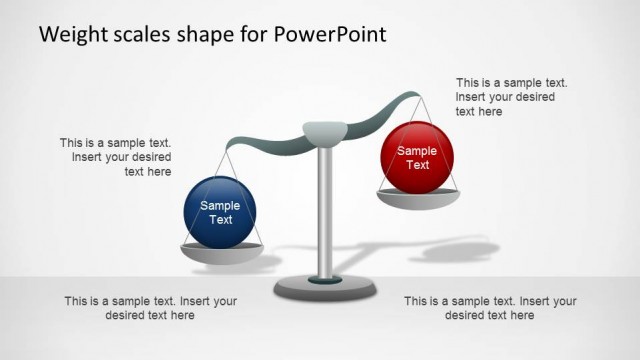
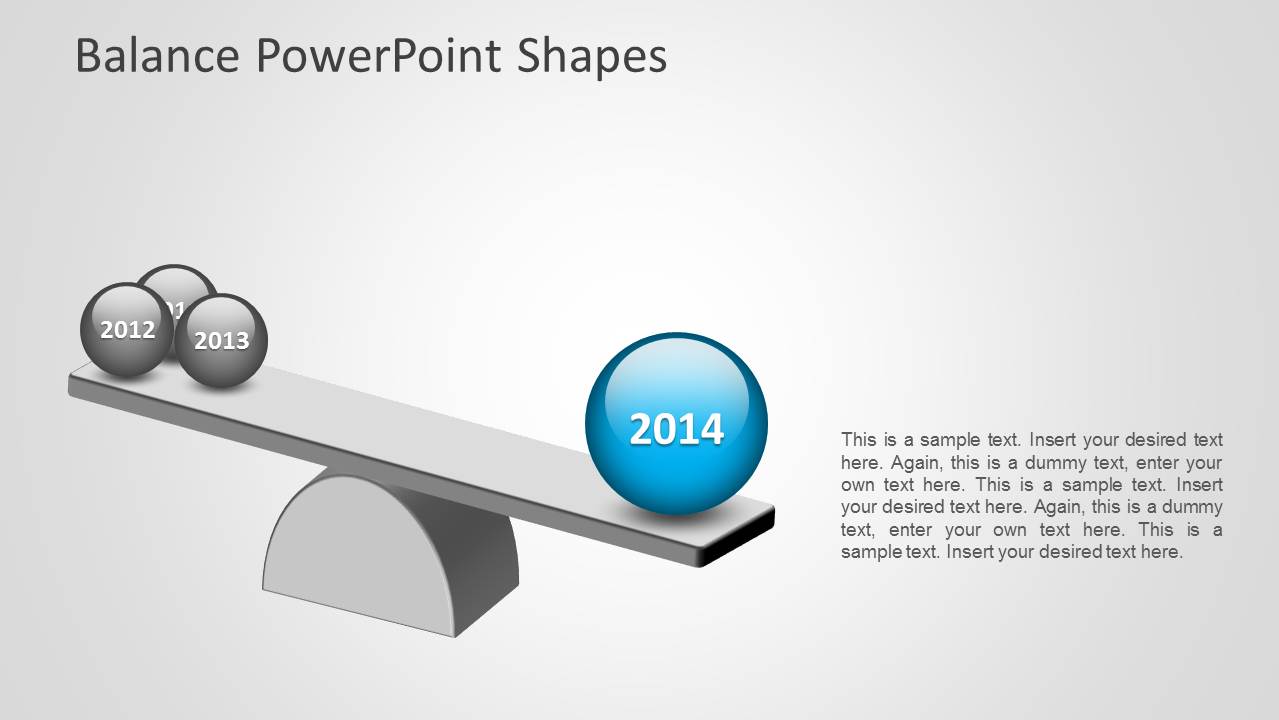
Balance PowerPoint Shape is a presentation design that you can download to support your presentations on comparison between different products or year-to-year comparisons for your business presentations. For instance you can use this balance template for PowerPoint to create slides and compare the actual year performance vs. the previous years.
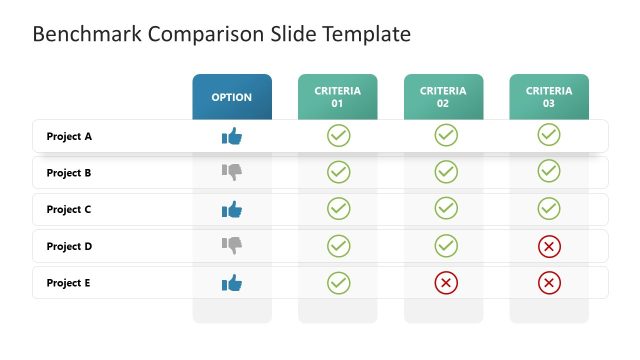
Alternatively you can download comparison slide designs and PowerPoint templates to make impressive slides for your presentations.
What’s inside this template
Example presentation scenarios
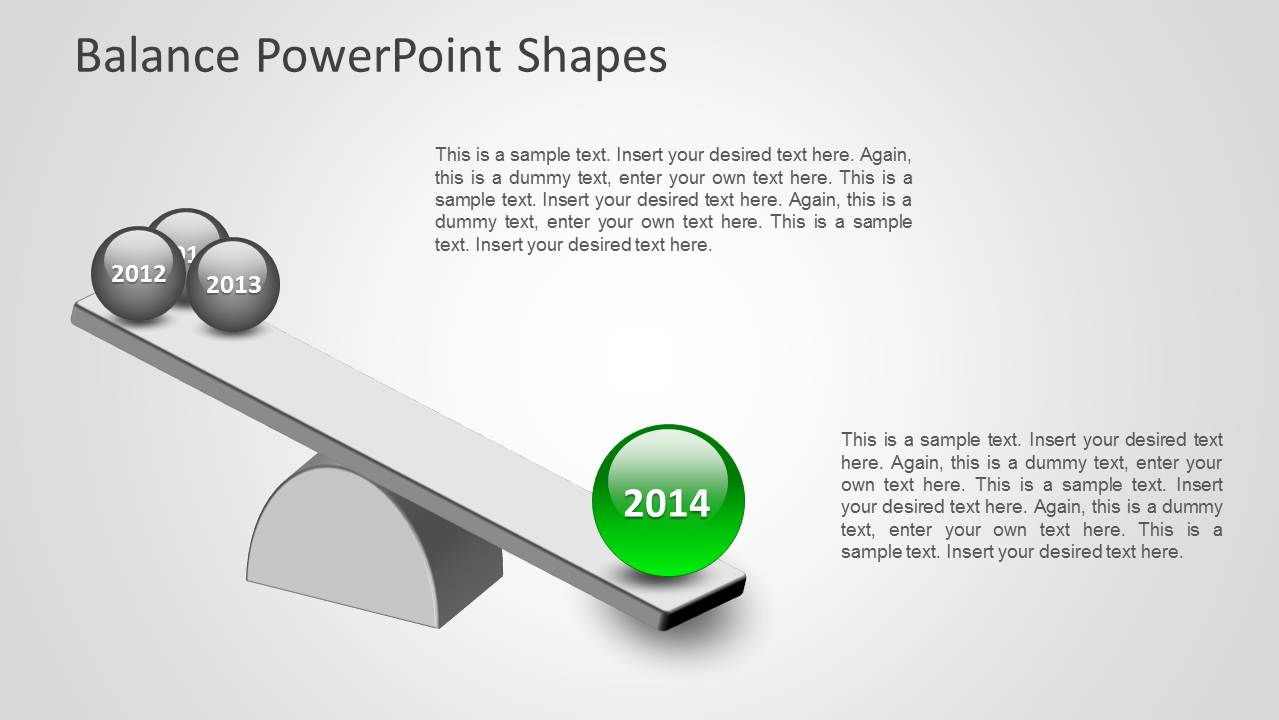
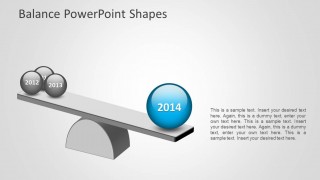
- A financial analyst can compare prior-year performance against current-year results using the year-labeled balance scale and explain why one period carries more weight.
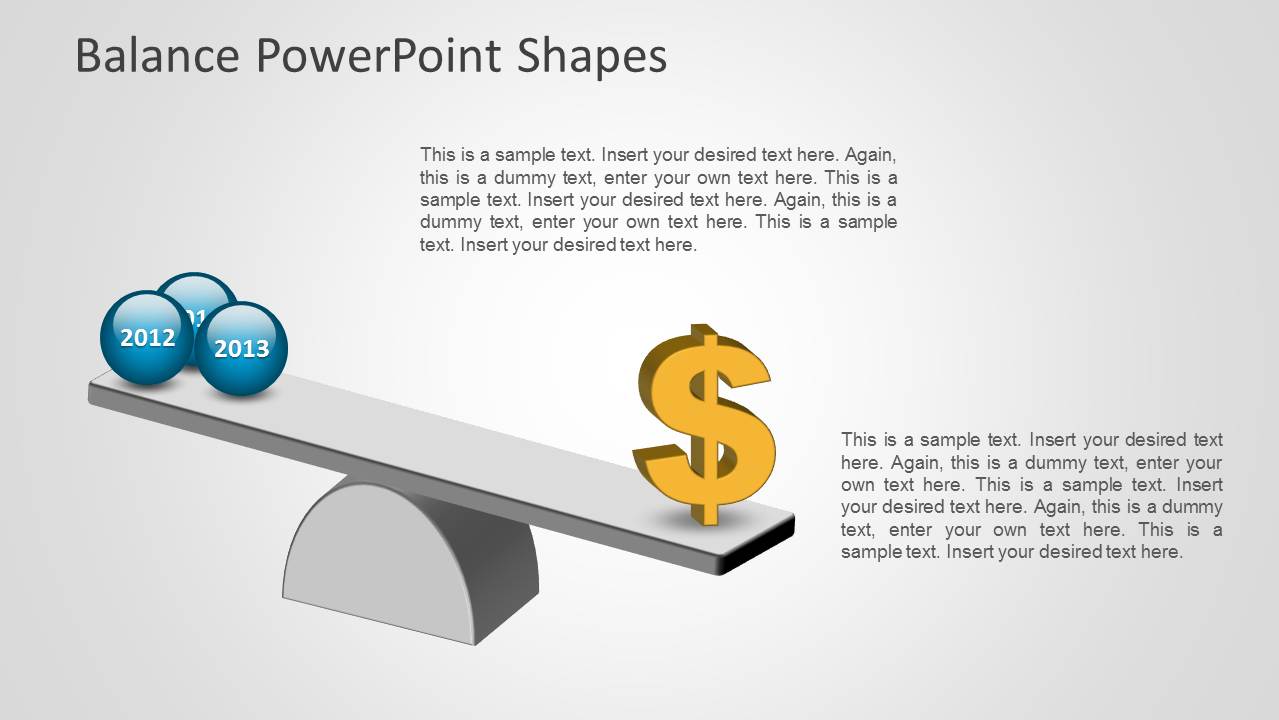
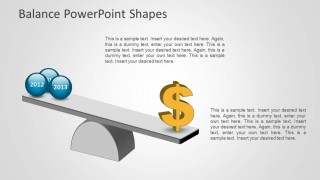
- A consultant can present a cost-benefit recommendation by placing a dollar symbol against past-year inputs and using the text blocks to explain the decision logic.
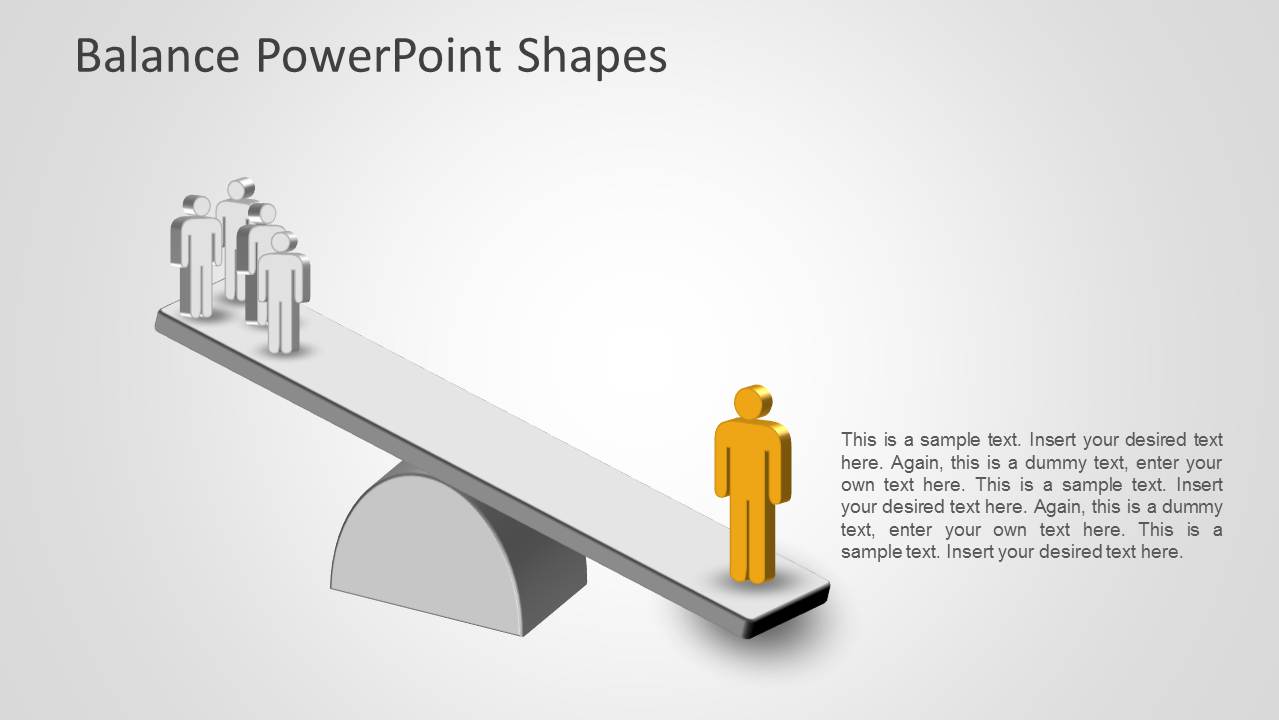
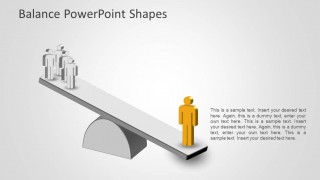
- An HR or operations manager can discuss resource allocation by comparing a group of people against one highlighted person on the people balance slide.
- A sales leader can frame a decision meeting by using the seesaw metaphor to show how customer value, revenue impact, or investment priority shifts toward one side.
Features
- 100% editable presentation template
- Compatible with Microsoft PowerPoint and Google Slides
- 16:9 aspect ratio slides
- Scalable vector shapes, icons and illustrations
- AI-Ready for Microsoft Copilot and Claude
- Instant access and download
Frequently asked questions
Q: How should a presenter explain the comparison without overloading the balance graphic?
A: Use the balance object as the headline idea, not as a data table. Put the main contrast in the title, reserve the text block for one or two reasons, and explain the visual weight verbally. The year spheres, dollar symbol, and people icons work best when each side represents a clear category.
Q: Who is this template best suited for in a business presentation?
A: It fits presenters who need to make a simple tradeoff easy to understand: analysts comparing years, consultants weighing costs against benefits, managers discussing staffing choices, or sales leaders framing value. The balance metaphor is strongest when the audience must quickly see which option, year, or group has greater impact.
Q: Why does the seesaw metaphor help communicate comparison?
A: A balance scale turns an abstract comparison into a physical relationship. The lower side appears heavier, so the audience reads priority or impact before reading the text. This makes the year, money, and people slides useful for decision meetings where the presenter wants the conclusion to be visually apparent.
Balance PowerPoint Shape
4-slide presentation template for balance comparison diagrams, yearly contrast, and decision tradeoff visuals
Balance PowerPoint Shape is a 4-slide comparison diagram template with 3D balance scale visuals, year-labeled spheres, a dollar symbol tradeoff slide, and a people group versus individual slide. It is built for business presenters explaining performance, priorities, or decision tradeoffs in Microsoft PowerPoint and Google Slides.
- Category
- Shapes
- Rating


 Loading...
- Aspect ratio
- 16:9, 4:3
- Item ID
- 1159
- Colors
 Microsoft PowerPoint
  Microsoft Copilot
  Claude for PowerPoint
 Other formats supported
Subscribe today and get immediate
access to download our PowerPoint templates.