Slide 1 of 4 from Balance PowerPoint Shape
Teeter Totter Metaphor Balance Slide
Balance Comparison Diagram for Presentations
- Diagram
- Comparison Split
- Comparison Slide
- 16:9
- 100% Editable
The Balance Comparison Diagram from the Balance PowerPoint Shape template offers a clear visual tool for year-over-year financial analysis and strategic decision-making. This slide layout uses editable shapes and vector icons to depict comparative data effectively, making it suitable for business presentations and pitch deck templates that require precise illustration of performance trends over multiple years.
About This Slide
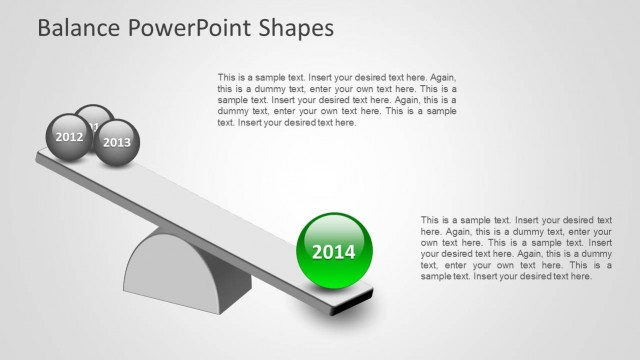
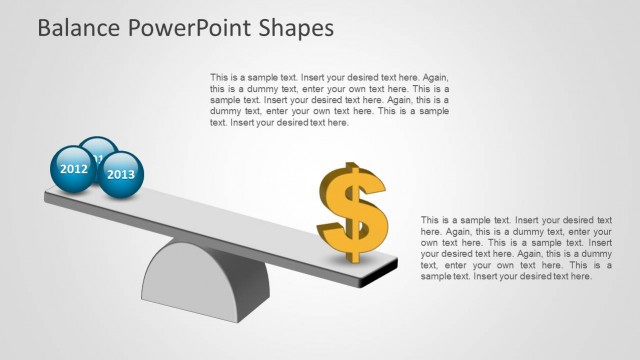
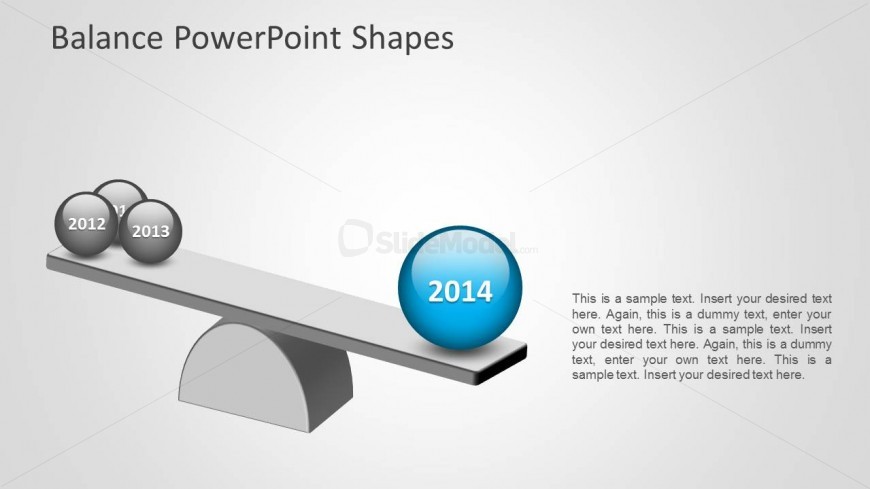
This slide presents a simple Teeter Totter created with powerpoint shapes, where in one side a group of years (represented by PowerPoint spheres) balance with the current year (here labeled as 2014). Each sphere and the Teeter Totter itself are 100% editbale by the user. Ideal for comparison presentations, this slide will help the presenter explain the concept of compared weight. At the right of the shapes a text box is placed for the description of the metaphor.
What’s on This Slide
The layout features a horizontal balance scale with three spheres positioned on the left and one larger sphere on the right. The left side contains two smaller gray spheres labeled '2012' and '2013,' while the right side has a larger blue sphere labeled '2014.' Text placeholders are located to the right of the blue sphere, aligned vertically. The overall color scheme includes gray for the scale and spheres, with a prominent blue for the 2014 sphere. The background is a light gradient, enhancing the visual hierarchy.
How to Use It
This layout serves as a comparison diagram, ideal for illustrating changes over time or trade-offs between multiple options. It fits well in a presentation sequence after introducing a problem or context, leading into a discussion of outcomes or decisions. Suitable scenarios include performance reviews, financial comparisons, or strategic planning discussions where year-over-year analysis is relevant.
Text Placeholders & Capacity
Keep your copy within these limits so it fits without resizing. Body slots can accommodate roughly 30-40 words each.
| Placeholder | Count | Max characters (approx.) |
|---|---|---|
| Slide title | 1 | 30 |
| Item heading | 3 | 4 |
| Body paragraph | 1 | 200 |
Slide Keywords
Download unlimited PowerPoint templates, charts and graphics for your presentations with our annual plan.
DOWNLOADReturn to Balance PowerPoint Shape.