Slide 3 of 4 from Balance PowerPoint Shape
Spheres Balance Comparison of Weight
Yearly Performance Comparison Slide
- Diagram
- Comparison Split
- Evaluation Slide
- 16:9
- 100% Editable
The Yearly Performance Comparison slide from the Balance PowerPoint Shape template offers a clear visual tool for evaluating annual data. This slide template integrates editable shapes and vector icons to illustrate financial comparisons across years, making it suitable for business presentations and strategic planning sessions. Its design supports effective communication of year-over-year performance metrics within a corporate presentation or pitch deck template.
About This Slide
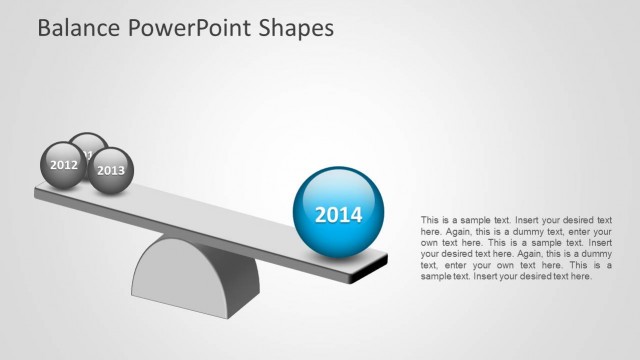
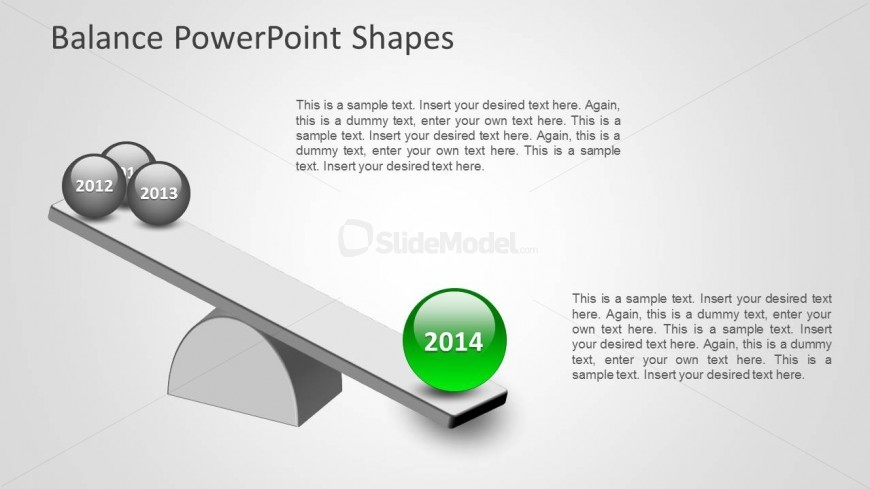
This slide describes a relative weight comparison between a group of years (represented by the three gray spheres) agains 1 year (represented by the green sphere) This slide is used in a sequence when the presenter wants to show the relevance in one topic of the current year against the previous ones. In example, the presenter could explain the increase of sales during this year have been bigger than the years before. All shapes are 100% editable and reusable across different presentations.
What’s on This Slide
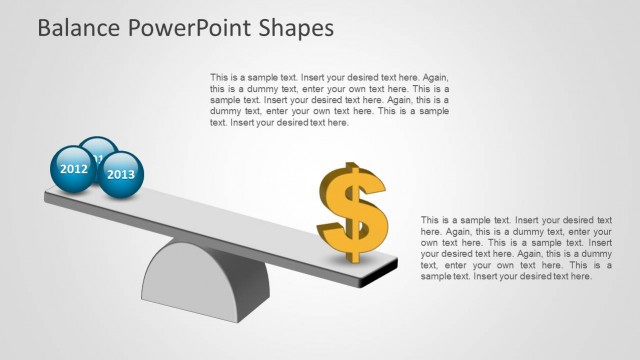
The layout features a balance scale with three spheres labeled 2012, 2013, and 2014. The spheres are positioned on either side of the scale, with the 2014 sphere being larger and colored green. Text placeholders are located above and below the scale, with a title at the top center and body text beneath the scale. The background is light gray, enhancing the 3D effect of the scale and spheres. The overall composition emphasizes the comparison of yearly data through visual balance.
How to Use It
This layout serves as a comparative analysis tool, showcasing yearly performance metrics. It fits well in a presentation sequence following an introduction to performance issues and preceding a detailed analysis. This structure is useful for business scenarios such as financial reviews, annual performance evaluations, or strategic planning discussions where year-over-year comparisons are essential.
Text Placeholders & Capacity
Keep your copy within these limits so it fits without resizing. Body slots can hold approximately 30-40 words each.
| Placeholder | Count | Max characters (approx.) |
|---|---|---|
| Slide title | 1 | 30 |
| Item heading | 3 | 4 |
| Body paragraph | 4 | 150 |
Slide Keywords
Download unlimited PowerPoint templates, charts and graphics for your presentations with our annual plan.
DOWNLOADReturn to Balance PowerPoint Shape.