Affinity Quadrant Diagram PowerPoint Template
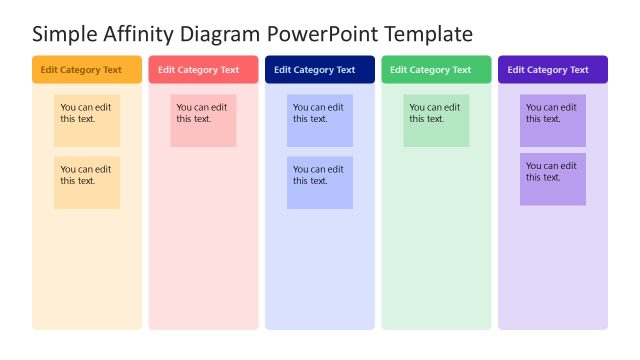
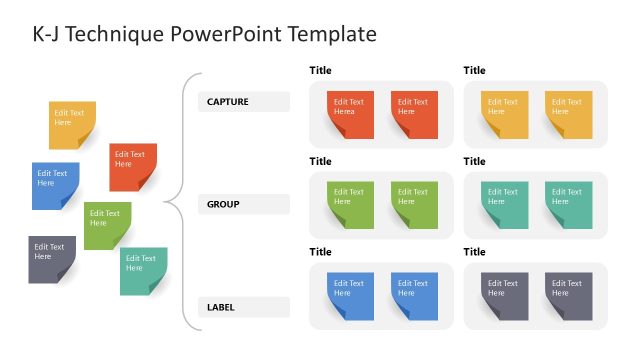
Download our modern and straightforward Affinity Quadrant Diagram PowerPoint Template to showcase scattered ideas in an arrangement pattern. An affinity diagram is a visual tool, also known as the K-J technique, named after its designer, Jiro Kawakita. The affinity diagram helps professionals organize the unstructured data into a structured format and arrange it in multiple groups. This helps professionals identify the underlying patterns and trends in data to find gaps, review results, and provide feedback. At first, users collect a large number of ideas, facts, observations, or other data points and display them on a large surface. They group similar ideas and categorize them by urgency, importance, and two metrics. Once everything is arranged, they review and iterate the process to make adjustments, ensuring nothing is skipped. Professionals can use this template in their stakeholder meetings to discuss how to solve complex problems.
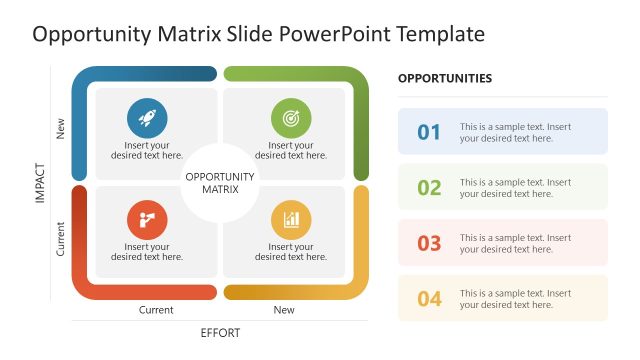
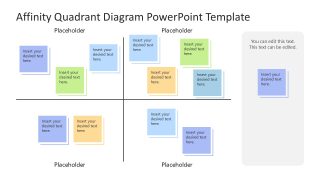
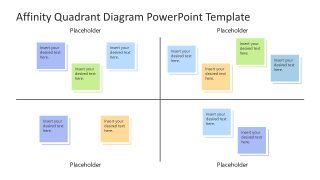
The template also allows them to organize research findings and brainstorm outcomes in project management, quality control, or other domains. The Affinity Quadrant Diagram PowerPoint Template includes two slides with a similar 2×2 matrix. The quadrant has dividing lines but no outer boundaries. On the right, a long vertically aligned text segment is also provided to include any important notes. In each quadrant, there are different numbers of colorful blocks illustrating sticky notes with placeholder text. The second slide has a similar quadrant diagram without the side box.
Professionals can change the colors, shapes, and other elements in the diagram template to match their theme and presentation needs. Download our affinity quadrant diagram presentation template to present the data accurately and help your teams move from chaos to clarity!


You must have an active subscription to download this file.
- Category
- Diagrams
- Rating
-

 Loading...
 - Size
- 16x9
- Item ID
- 23361-01
- Colors
Subscribe today and get immediate
access to download our PowerPoint templates.