Quadrant Chart Templates for PowerPoint and Google Slides
Our Quadrant Chart Templates PowerPoint provides a solution for creating professional-quality charts. These templates are designed to help you showcase and organize information in a way that is easy to understand and digest.
With various design options and features, you can choose the perfect quadrant chart to fit your needs. Whether you’re looking to showcase data points, identify market trends, or make strategic decisions, our Quadrant Chart Templates can help you do it quickly and easily
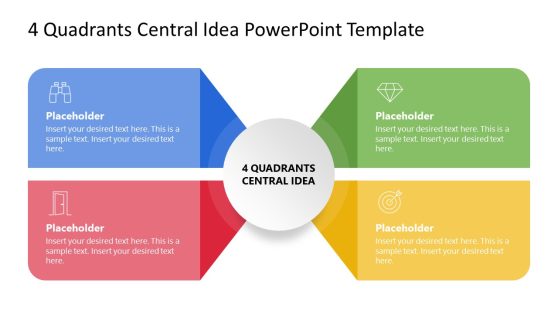
4-Quadrant Central Idea PowerPoint Template
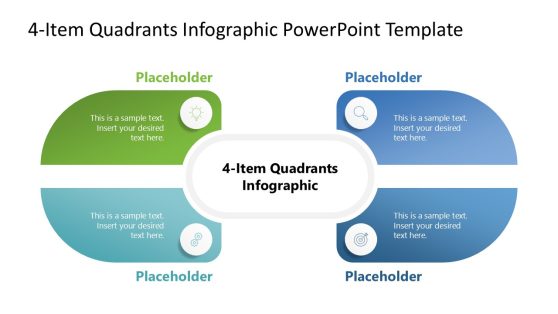
4-Item Quadrants Infographic PowerPoint Template
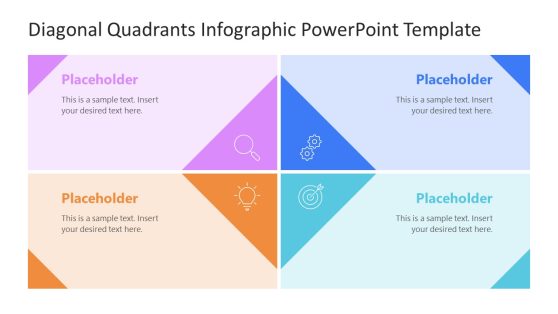
Diagonal Quadrants PowerPoint Template

Profitability Matrix PowerPoint Template
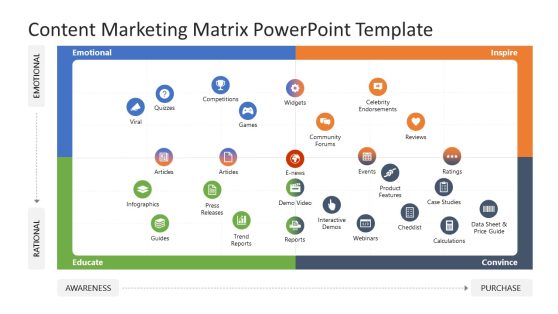
Content Marketing Matrix PowerPoint Template
A Quadrant Chart is also known as a cartesian coordinate chart or a 4 quadrant chart. It is a visual representation of data into four equal sections. Our Quadrant Chart Template will help you analyze and compare your data based on two variables.
Whether you want to analyze sales data, market trends, or project status updates, our Quadrant Chart Templates can help you present your data. You can easily identify trends and patterns in your data and make informed decisions to help you achieve your goals.
Also, our Quadrant Chart is not limited to Microsoft PowerPoint; you can use it with other popular presentation software such as Keynote and Google Slides. This compatibility allows for seamless integration and flexibility, enabling you to utilize the chart on any platform easily.
What Is A Quadrant Chart?
A quadrant chart is a graphical representation of data that divides a chart into four equal parts or quadrants. It is a tool used to analyze and visualize the relationship between two variables by comparing their position on the horizontal and vertical axes.
Quadrant charts are commonly used in business, marketing, and project management to help identify trends, assess risk, and make informed decisions.
How Do You Make A Chart With 4 Quadrants?
To make a chart with 4 quadrants, you need to follow these step-by-step carefully:
- You start by choosing a preferred software that allows you to create quadrant charts, such as Microsoft Excel, PowerPoint, or Google Sheets.
- Create a table with two columns and two rows.
- Label the horizontal and vertical axes with the variables you want to analyze.
- Divide both axes evenly to form four quadrants.
- Plot the data points on the chart by identifying their position on the horizontal and vertical axes.
- Ensure that you label each quadrant to identify data points within it easily.
- However, you can add further information or formatting to the chart to make it more appealing and informative.
How Do You Create A Quadrant Chart In PowerPoint?
To create a quadrant chart in PowerPoint, you can use the SmartArt feature to insert a pre-made quadrant chart template. Alternatively, you can manually create a chart by inserting a grid, dividing it into four equal parts, and labeling each quadrant with the appropriate axis labels and data points.
How Do I Split A PowerPoint Slide Into 4 Quadrants?
To split a PowerPoint slide into 4 quadrants, you can divide the slide into equal parts using the gridlines feature. Then, insert shapes or text boxes in each quadrant to add content or data points. You can also use the alignment tools to ensure that each quadrant is evenly spaced and aligned.