This A/B Testing PowerPoint template is a presentation design template containing useful slides that you can reuse in an A/B Testing presentation. You can use A/B testing either on startups but also in established businesses.
A/B testing is a simple way to test changes to your product features against the current design, and then you can determine which ones produce the best results. By using A/B testing you can validate that any new design or landing page is improving your conversion rates.
Inside this Split Testing PPT template you can also find useful slides including different versions of a product represented by computer screens and showing a browser illustration, but also present the results of an A/B Testing Analysis conducted by your company or team.
What’s inside this template
Example presentation scenarios
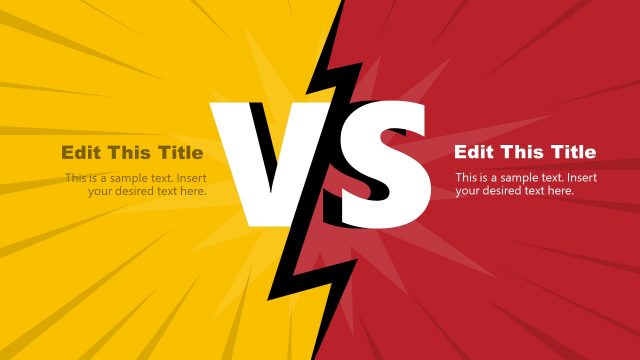
- A growth marketing manager can use the Version A versus Version B comparison and winner callout slides to report which landing page produced better conversions.
- A product manager can use the before-and-after optimization slide to explain how a tested interface change differs from the current experience.
- An e-commerce analyst can use the visitor allocation diagram and baseline traffic split slide to show how traffic was divided across test groups.
- A startup founder can use the line chart result slides to summarize test momentum and support a decision to keep the stronger variant.
Features
- 100% editable presentation template
- Compatible with Microsoft PowerPoint
- Scalable vector shapes, icons and illustrations
- AI-Ready for Microsoft Copilot and Claude
- Instant access and download
Frequently asked questions
Q: How should a presenter structure the A/B testing story with this template?
A: Start by naming the experiment and showing the two alternatives, then move to the winner slide before explaining traffic allocation and result trends. This order helps the audience first understand what changed, then see the decision, and finally review the evidence behind the conclusion.
Q: Who is this template best suited for in a business presentation?
A: This template fits marketing, product, growth, and e-commerce presenters who need to discuss digital experiments without building a full analytics dashboard. The web page mockups, conversion callouts, visitor split diagram, and line charts are useful when the message is about comparing two alternatives and choosing one direction.
Q: Why does the template use browser mockups and A/B color markers?
A: The browser mockups make the tested experience concrete, while the red, green, and yellow markers separate variants and outcomes at a glance. This visual metaphor mirrors a real landing page test, so decision makers can connect traffic, conversion, and winner selection without reading dense analysis text.


A/B Testing PowerPoint Template
8-slide A/B testing presentation template with version comparisons, visitor splits, and conversion result charts
A/B Testing PowerPoint Template is an 8-slide presentation for explaining split-test experiments and results. It includes a cover, Version A versus Version B comparison, winner callout, before-and-after optimization layout, visitor allocation flow, baseline traffic split, and line chart result slides for marketing, product, or e-commerce teams using Microsoft PowerPoint.
- Category
- Business PowerPoint Templates
- Rating


 Loading...
- Item ID
- 6537-01
- Colors
 Microsoft PowerPoint
 Microsoft Copilot
 Claude for PowerPoint
Other formats supported
Subscribe today and get immediate
access to download our PowerPoint templates.