A/B Testing Sales Report Chart for PowerPoint
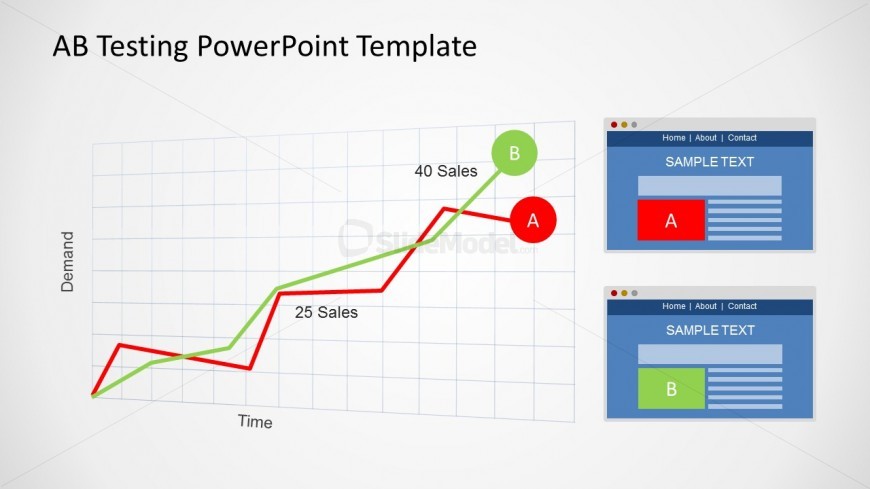
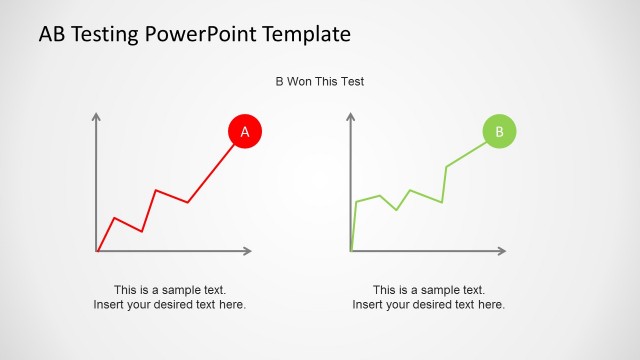
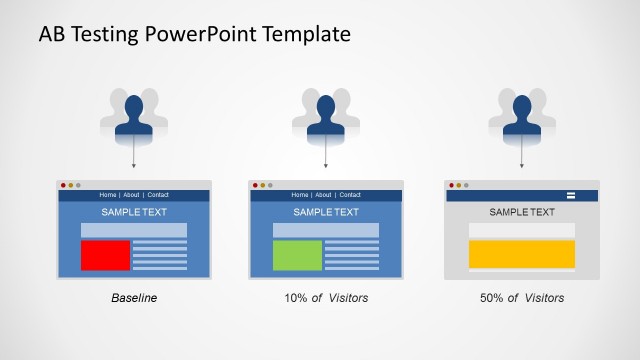
This Office template may be used to compare two distinct yet similar elements which contribute to the business process. It contains an A/B testing sales report chart for PowerPoint, consisting of two line chart series showing the correlation of time and demand in the increase and decrease in sales. Beside this line chart are two browser illustrations showing the two elements being compared.
This slide design is optimal for the comparison of online sales, site traffic, and website ads revenue. The PowerPoint objects are 100% editable to suit the presenter’s needs and preferences.
Return to A/B Testing PowerPoint Template.