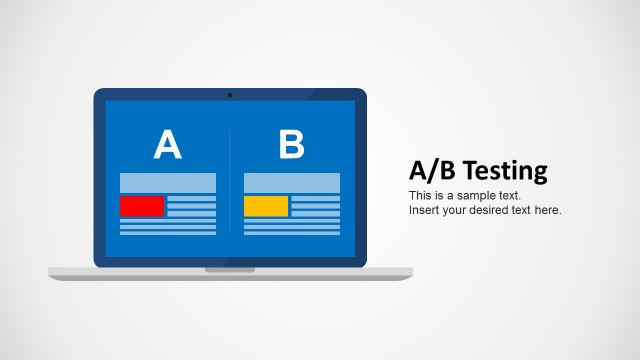
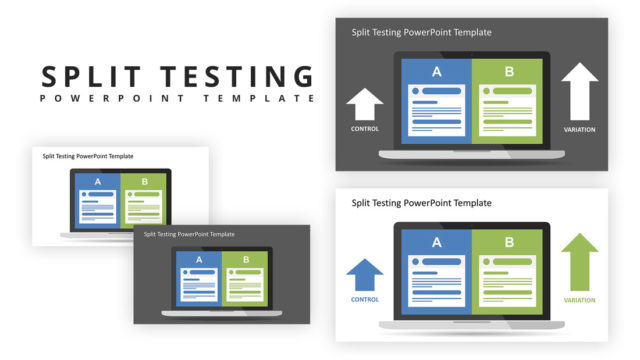
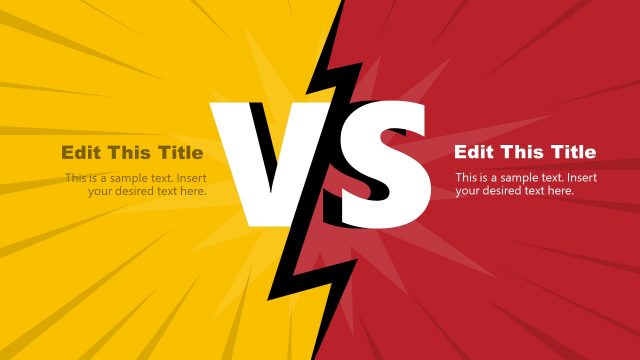
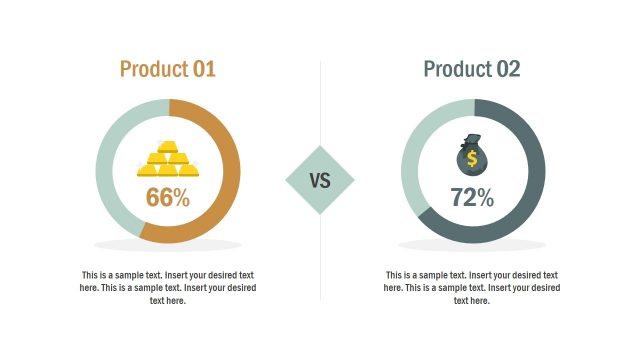
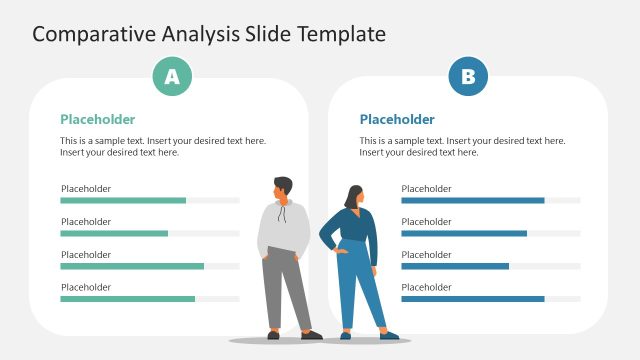
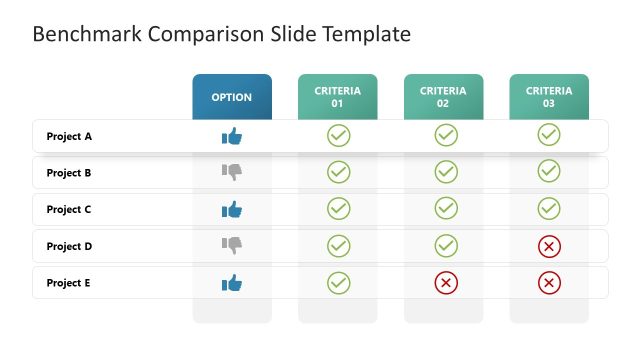
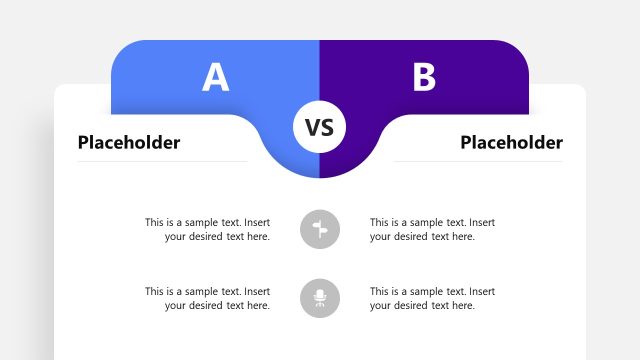
A/B Testing Results Comparison for PowerPoint is a professional presentation created to contrast the results of an A/B Testing Experiment or split test that concluded. The template provides a comparison slide and a specific slide for each sample.
A/B testing has become an extremely popular term in the Digital Marketing jargon when speaking of websites (or mobile apps) that are modified in some of their aspects, and are tested against an audience concurrently. This kind of testing provides statistical significant results, that serve as input for the Digital Marketing decision process.
All the elements in the template are crated as PowerPoint shapes, allowing the user to fully customize every property, and also to port all the shapes through different presentations.
Combine this impressive templates with our A/B Testing PowerPoint Template and close the cycle from preparation, design, execution and termination.
Share your conclusions and results with our flexible A/B Testing Results Comparison for PowerPoint that appeals to executive audiences.
What’s inside this template
Example presentation scenarios
- A digital marketing manager can use the Champion versus Challenger comparison slide to summarize which landing page variant produced the stronger conversion rate after a campaign test.
- A product manager can use the individual Champion and Challenger result cards to explain how user behavior differed between two feature treatments during a product experiment review.
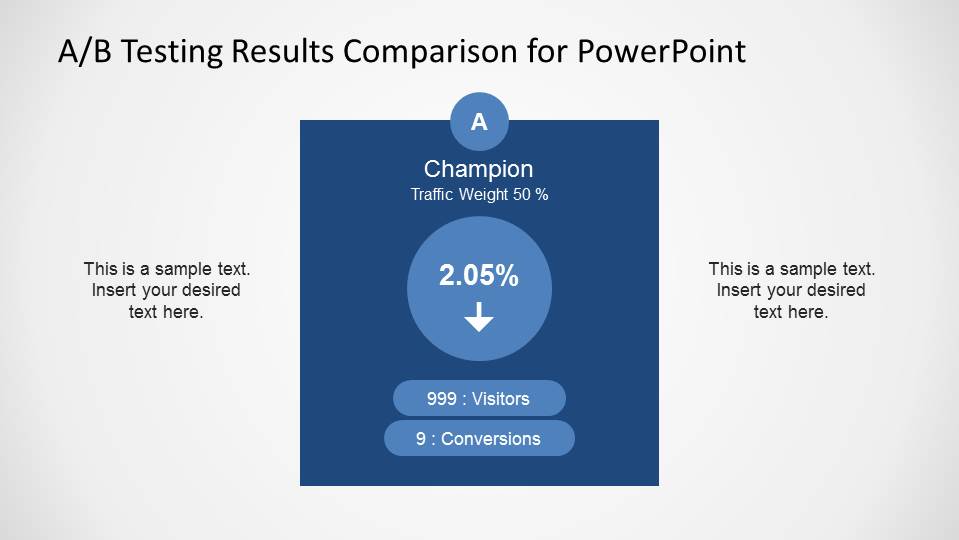
- An e-commerce analyst can present visitor counts, conversion totals, and confidence on the metric cards to support a decision about replacing an existing page design.
- A growth team lead can use the side text placeholders on the detail slides to add context about the test setup, audience split, and next recommendation.
Features
- 100% editable presentation template
- Compatible with Microsoft PowerPoint and Google Slides
- 16:9 aspect ratio slides
- Scalable vector shapes, icons and illustrations
- AI-Ready for Microsoft Copilot and Claude
- Instant access and download
Frequently asked questions
Q: How should a presenter explain the A/B test result without overwhelming the audience?
A: Start with the comparison slide so the audience sees Champion and Challenger side by side before hearing details. State the traffic split, the visible conversion rates, and the direction of the arrows. Then use the Champion and Challenger detail slides to explain what changed, why it matters, and what decision the data supports.
Q: Who is this template best suited for in a business review?
A: This template fits marketers, growth teams, product managers, and e-commerce analysts who need to report the outcome of one completed split test. It works best when the decision is binary: keep the Champion, adopt the Challenger, or run another test based on conversion rate, visitors, conversions, and confidence.
Q: Why does the Champion versus Challenger format work for A/B test communication?
A: The Champion and Challenger labels create a simple contest metaphor that executives can understand quickly. The two cards keep the variants parallel, while the separate detail slides give each option enough space for explanation. Directional arrows and large percentage circles guide attention to the performance signal before supporting numbers are discussed.



A/B Testing Results Comparison for PowerPoint
3-slide presentation template for A/B testing results, conversion rate comparison, and Champion Challenger metrics
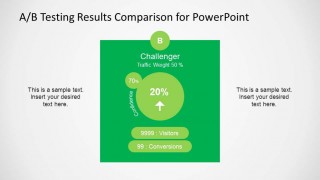
A/B Testing Results Comparison for PowerPoint is a 3-slide presentation template for reporting a completed split test. It includes a side-by-side Champion versus Challenger comparison, a Champion result card, and a Challenger result card with conversion rate, traffic weight, visitors, conversions, and confidence callouts for marketing or product teams in Microsoft PowerPoint and Google Slides.
- Category
- Business PowerPoint Templates
- Rating


 Loading...
- Aspect ratio
- 16:9, 4:3
- Item ID
- 6537-02
- Colors
 Microsoft PowerPoint
 Microsoft Copilot
 Claude for PowerPoint
Other formats supported
Subscribe today and get immediate
access to download our PowerPoint templates.