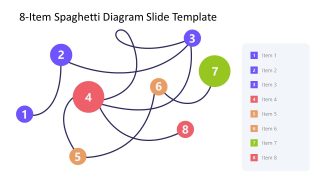
8-Item Spaghetti Diagram Slide Template for PowerPoint
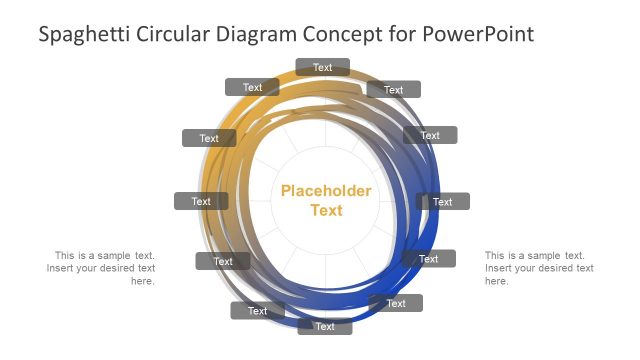
The 8-Item Spaghetti Diagram Slide Template for PowerPoint is a network illustration for presenting process flows, complex associations, and complications. As its name indicates, a spaghetti diagram is a noodle-like structure of lines that helps indicate the process steps in a system and is often used to discuss flaws in different areas. This PPT slide template features a set of editable slides with multiple design representations of the 8-item spaghetti diagram. Users can choose from these slides and present flow possibilities. We have crafted these diagrams using 100% editable shapes and labels. Project managers, operational directors, or analysts can download this template for professional presentations.
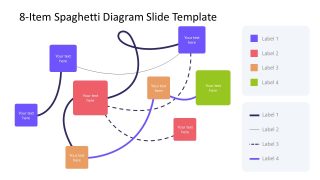
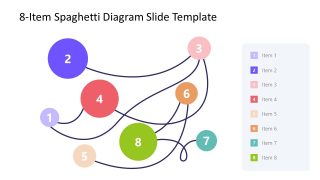
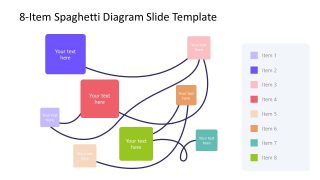
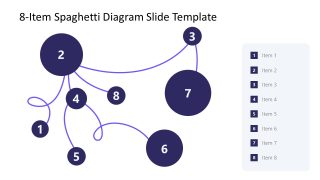
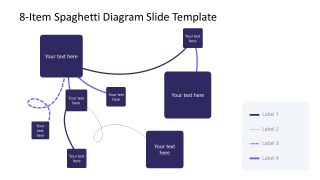
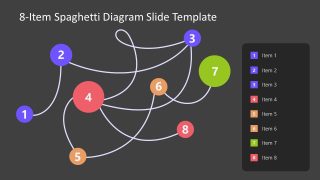
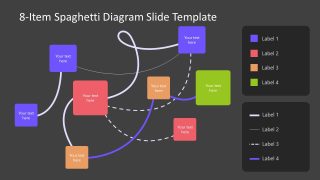
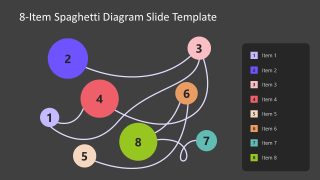
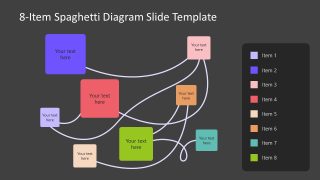
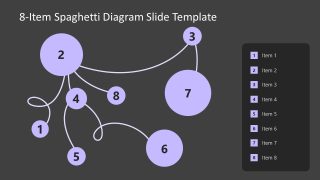
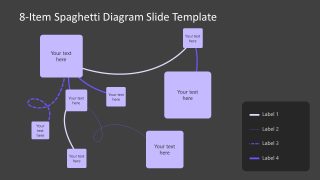
This 8-Item Spaghetti Diagram Slide Template for PowerPoint carries six design variants of the spaghetti diagram, each provided in two background colors, i.e., white & dark. The first layout has a line network with circular labels at distant points. These circles have varying sizes and numbers inside them. A legend with corresponding colors is also provided on the right side to add details of these items. Next is the slide where, instead of circles, square boxes are used, and some of the lines are solid while others are dashed. Another separate legend for the line types is also provided. In the third spaghetti design, the arrangement of the shapes and the network of lines is also different. The fourth spaghetti layout is a variant of slide three but with square shapes. Slide five displays the spaghetti diagram with dark-colored shapes, and the sixth shows the square shapes with dashed lines.
This Spaghetti PPT template is not limited to industrial or operations management use, it can be applied in a wide variety of real-world scenarios. For example, in manufacturing settings, it helps visualize the movement of materials or workers on a shop floor, aiding in lean analysis and layout optimization. In the healthcare sector, professionals can use it to map patient flow across departments and identify points of congestion or delays in care.
In marketing and customer experience, the spaghetti diagram can represent a customer journey map, visually highlighting the different touchpoints and possible loops or pain points in the customer lifecycle. UX/UI designers can use it to outline user interaction flows across digital products, particularly when screens or processes are interconnected in complex ways.
The spaghetti template is also valuable for logistics and supply chain PPT presentations, where it can demonstrate how goods or data move through systems or regions. IT professionals can use it to showcase network architecture or data transfer paths, while academics and educators can apply it to illustrate complex theoretical relationships or interlinked variables in a research model.
Users can edit this PPT template with all versions of Microsoft PowerPoint, Google Slides, Keynote and also in Canva presentations. Professionals can also change the colors and shapes of the template according to their needs. So, download this engaging template to make amazing presentations. Try it now!


You must be logged in to download this file.
DOWNLOAD- Category
- Diagrams
- Rating

 Loading...
- Size
- 16x9
- Item ID
- 61067
Subscribe today and get immediate
access to download our PowerPoint templates.