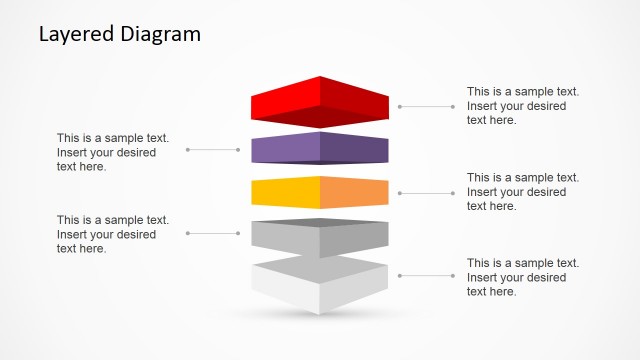
3D Bar Staged Process Diagram for PowerPoint
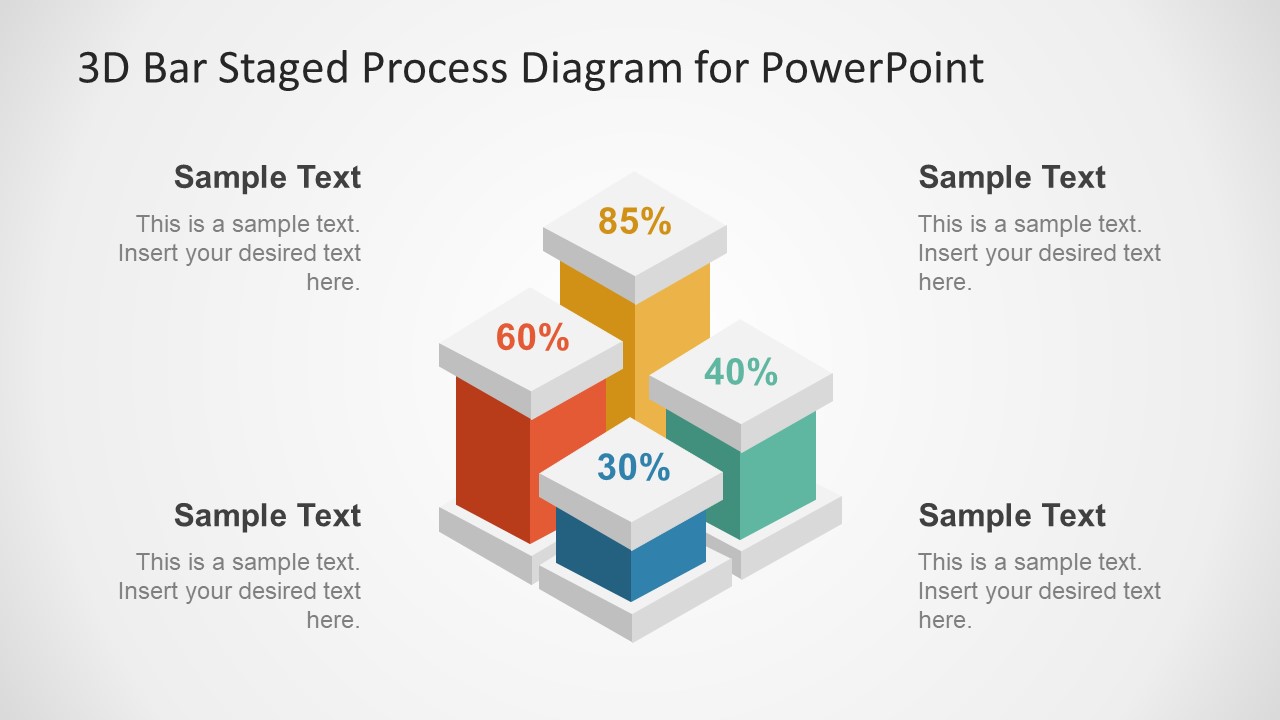
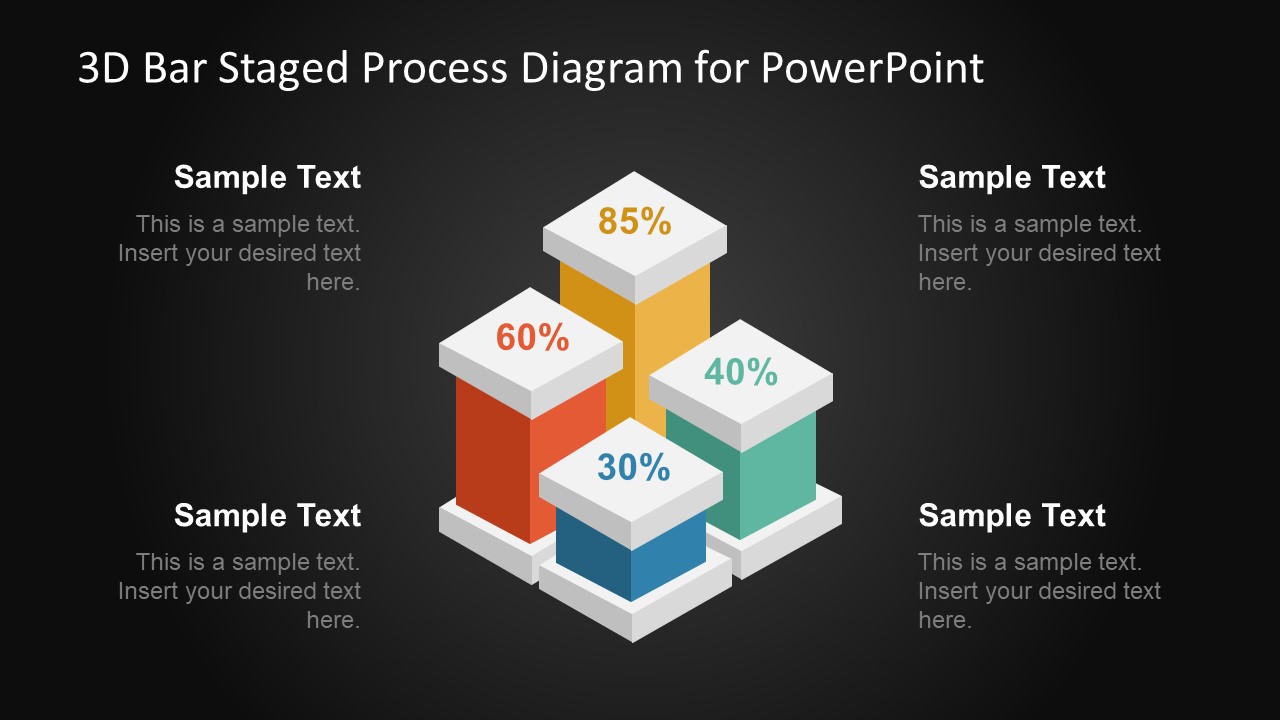
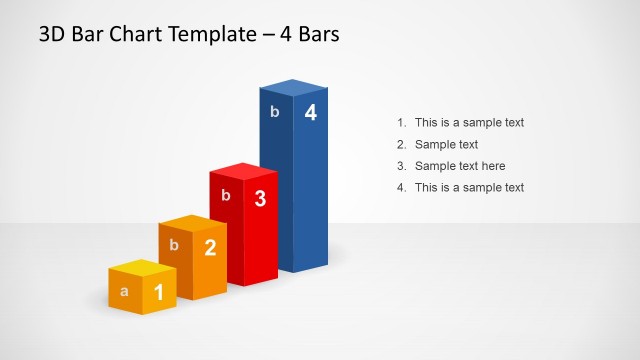
The 3D Bar Staged Process Diagram for PowerPoint is an elegant and unique design of bar chart template. The 3D cubic style gives a professional look and feel to the template. Therefore, 4 stages diagram are usable in business presentation as well as the competitions presentations. Such as, position is academic and sports or progress level of products or staff members. For instance, use this PowerPoint to explain market analysis of customer segmentation and categories on age or feature usage grounds. Unlike a regular column chart, the four stages bar diagram is the visual of three-dimensional graph. It can show the relationship between inclusive or exclusive entities. Moreover, present financials like revenue forecast and growth analysis or other economics related topics.
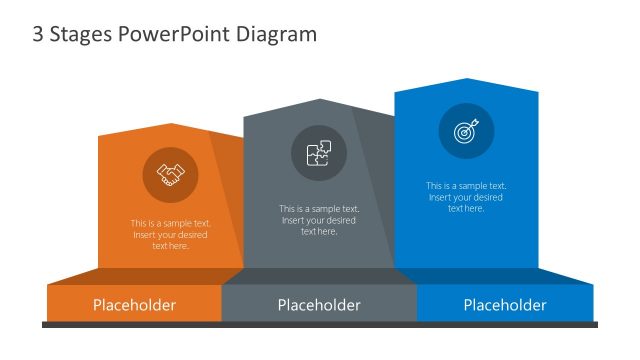
The 3D Bar Staged Process Diagram for PowerPoint is a vector graphic template of high-resolution shapes. Hence, it is easier to alter the size of images without affecting the picture quality. For example, increase or decrease the bar length to show growth value simply by dragging shapes in respective direction. This editable PowerPoint contains two slides of different background versions, which gives the idea of changing colors. The 3D bars illustrate a stage design with numbers and text placeholders as reference. These placeholders assist in adding presentation information with title and caption. The simple background of template also has a gradient effect, which has dimmer light towards the center. This incredible effect helps audience to focus on diagram more.
Although it is a predesign template, to copy in other slideshow, quickly alter the text present. The PowerPoint diagram of 3D staged process enables users to customize various properties of the template. Such as, theme and layout, recoloring the objects, adding elements, moving or resizing etc. Also, there is a feature to insert spreadsheet, PowerPoint and word files to support the diagram topic using objects button. Use this multi-block slide to enhance business presentation in stages.
