Ever wondered how the audience perceives charts in PowerPoint slides? Without legends, trendlines, or supporting text, charts can be quite confusing. Even with this information, the audience may need some time to grasp the chart, leaving room for misinterpretation. If you work with datasets translated into charts, a Pareto chart can be a good measure of showing key information in PowerPoint slides.
In this guide, you’ll learn what a Pareto chart is, why it’s useful, and how to build your own Pareto diagram in PowerPoint. We’ll also explain the concept using simple metaphors and discuss how Pareto charts are commonly used in business and operations.
What Is a Pareto Chart
Instead of treating all factors as equally important, a Pareto chart helps you focus on the small number of causes that have the greatest impact. A concept rooted in the well-known 80/20 rule. A Pareto chart is a combination of two chart types, namely a column chart that displays categories in descending order of importance, and a line chart that shows the cumulative percentage of impact. The bars help you see which categories contribute the most, while the line shows how those contributions add up over time. This dual view makes it easy to spot the primary causes that drive most results.
The Iceberg Metaphor
A helpful way to understand a Pareto chart is to think of an iceberg. What you see above the water represents the few visible issues that account for most of the problem. Beneath the surface are many smaller factors that exist, but contribute far less. Pareto charts help you focus on what’s above the waterline, where effort delivers the greatest return.
Common Uses
Pareto charts are especially popular in business and operations, including quality control to defect types and error causes, customer complaints analysis, assessing sales performance by product or region, process improvement and efficiency studies, IT or service desk issue tracking, etc.
Why Use Pareto Charts in PowerPoint
Pareto charts are widely used because they turn complex data into clear priorities. The following are the various benefits of using a Pareto graph PPT.
Highlight Key Information
Instead of spreading effort across dozens of issues, Pareto charts show which ones deserve immediate attention. In fact, any situation where you need to prioritize actions based on impact is a good candidate for a Pareto chart.
Support Decision-making
Teams can allocate time, budget, and resources based on impact rather than assumptions.
Smplify Communication
A Pareto graph PPT makes it easy to explain priorities to stakeholders without diving into raw data tables.
Pareto Principle (80/20 Rule)
The Pareto Principle suggests that a large portion of outcomes. Often, about 80% results from a relatively small share of causes, typically about 20%. It highlights the natural imbalance between effort and impact and helps explain why focusing on a few critical factors can produce outsized results. Pareto charts translate this concept into a practical visual, making it easier to identify and act on the most influential contributors. For a deeper explanation of this idea, see our guide on the Pareto Principle.
How to Create a Pareto Chart in PowerPoint
Modern versions of Microsoft PowerPoint include Pareto charts as a built-in option. Below is a step-by-step guide on how to make one. To demonstrate the process, we will be using the Pareto Principle PowerPoint Template.
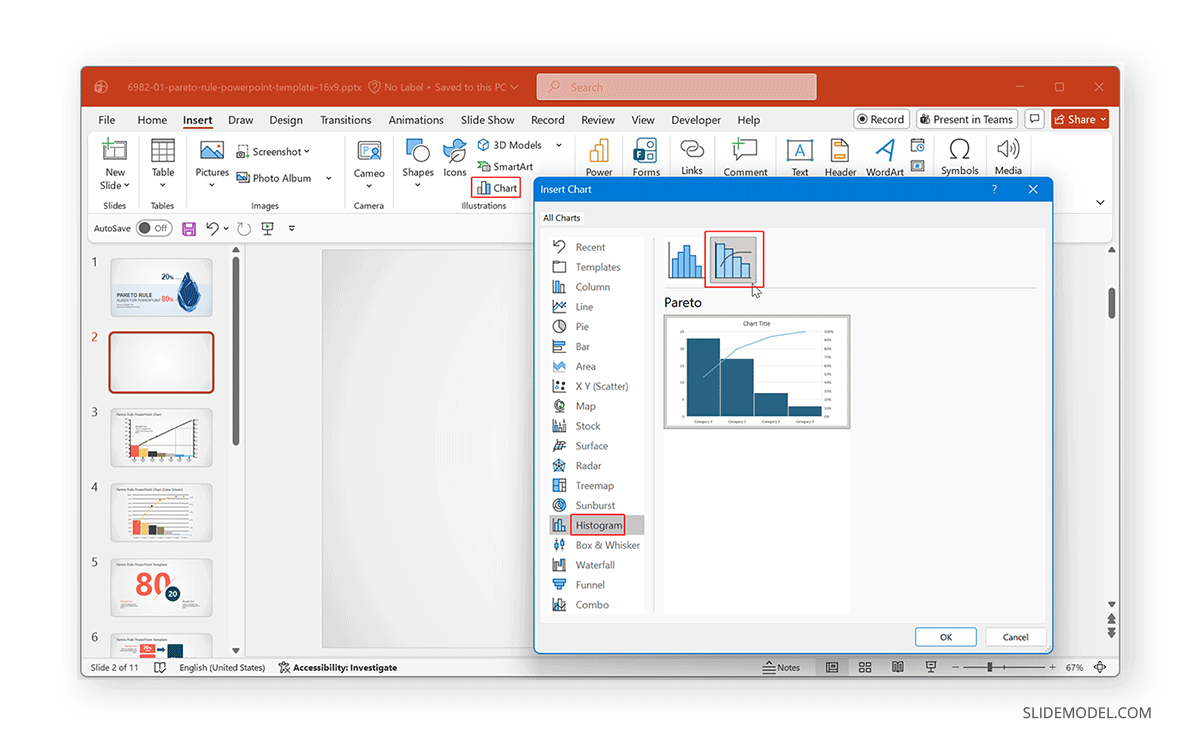
Step 1: Insert a Pareto Chart via Insert -> Chart.
Step 2: Select Histogram from the chart categories and select Pareto. This will insert a default Pareto chart and open an Excel worksheet for data entry.
Step 3: Replace the default data with your own to construct your chart. In the Excel sheet, enter the following:
- Categories in the first column (e.g., issue types or causes).
- Numeric values in the second column (e.g., frequency or cost).
PowerPoint automatically sorts the categories from highest to lowest value and calculates the cumulative percentage for the line chart.
Tip: Use absolute numbers (counts, totals, and costs) rather than percentages, since PowerPoint handles percentage calculations for you.
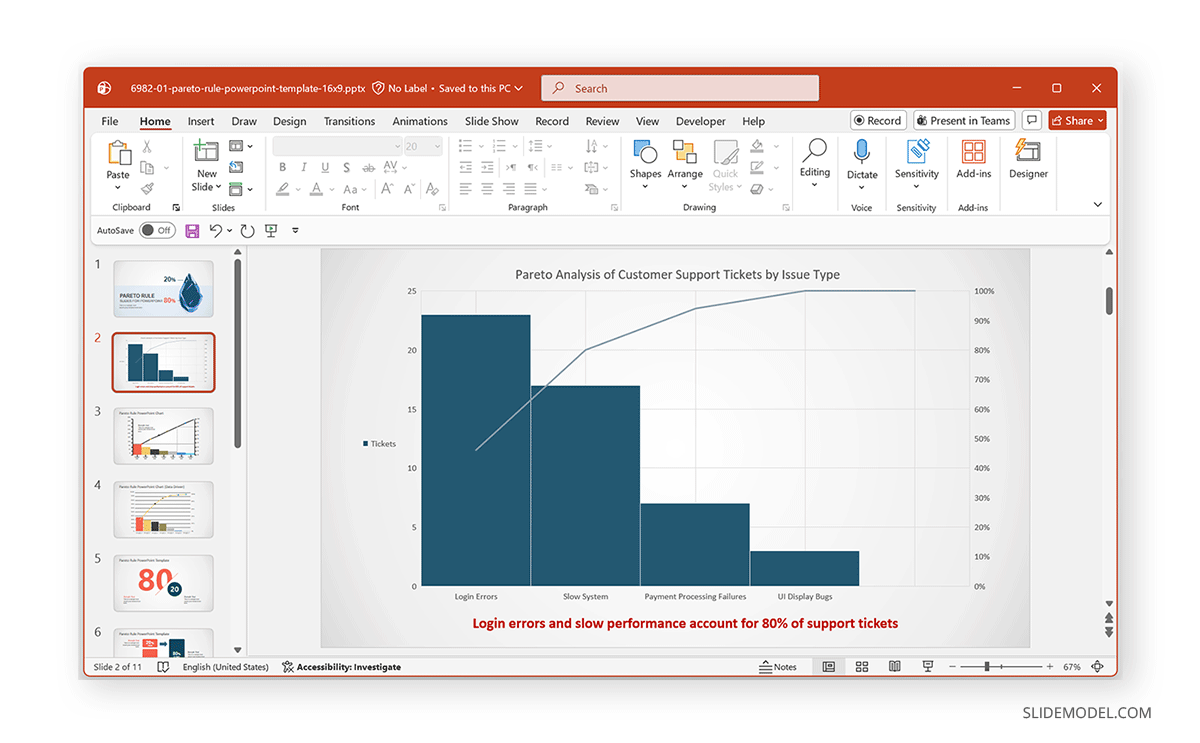
Step 4: To make the chart easy to interpret, add a chart title that explains what is being analyzed and label the primary axis with the metric (e.g., “Number of Defects”). Ensure the secondary axis clearly shows cumulative percentage (0–100%). This will help the audience to quickly understand what each element in the chart represents.
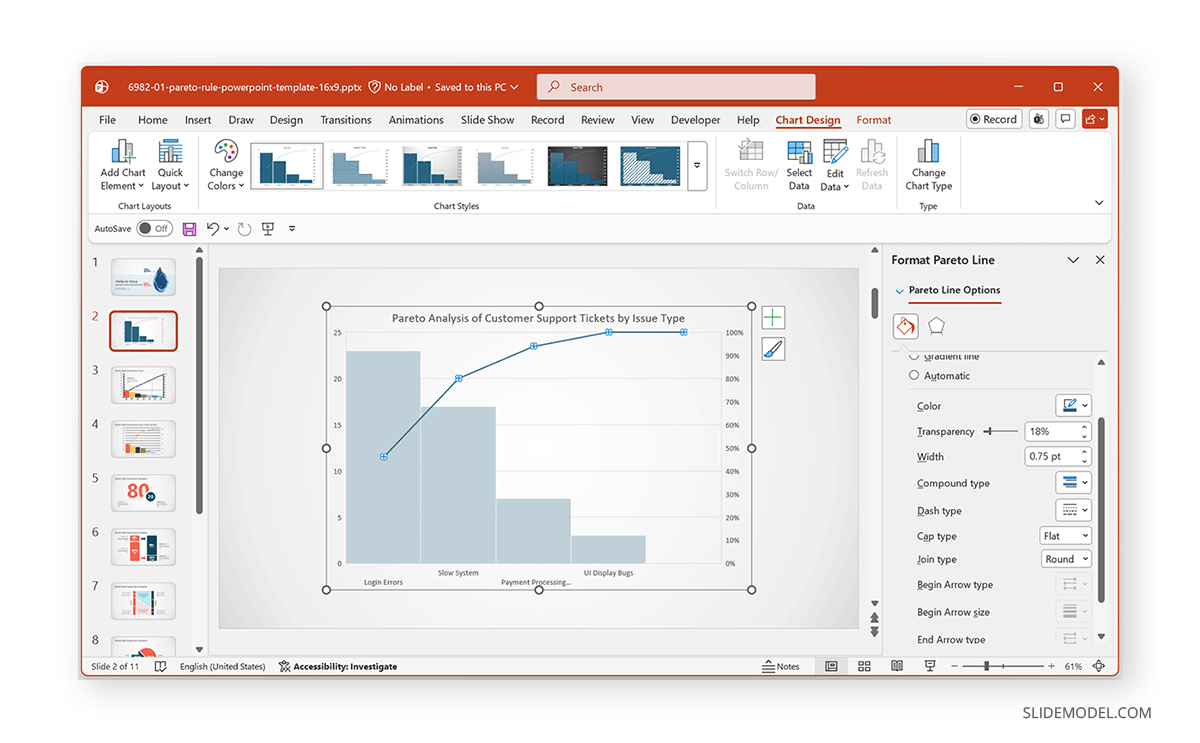
Step 5: Small formatting changes can significantly improve readability. Use the Format or Chart Design tab, or Format Plot Area (right-click menu) to edit the design for clarity. You can use the following to enhance audience readability.
- Use a neutral color for most bars and a highlight color for key categories.
- Make the cumulative line stand out with a contrasting color.
- Reduce gridline intensity so the data remains the focus.
Interpreting a Pareto Diagram
A Pareto diagram in PowerPoint is most powerful when interpreted correctly. To interpret such a chart, look for the point where the cumulative line reaches roughly 80%. The categories to the left of this point typically represent the vital few causes that drive most of the outcome. The remaining categories contribute less and may be lower priority. This visual cue makes it easier to decide focus areas.
When to Use Pareto Charts and How to Present Them
When Pareto Charts Work Best
Pareto charts are most effective when the goal is to prioritize issues or causes rather than simply compare numbers. They are especially useful when data can be ranked by impact and when focus and efficiency are important. In these situations, a Pareto chart helps teams identify the few factors that contribute most to an outcome, making it easier to decide where to focus their efforts and resources.
When Pareto Charts Are Not the Right Choice
Not every dataset lends itself to a Pareto analysis. If categories are all roughly equal in importance, or if the data cannot be meaningfully ranked, a Pareto chart may add unnecessary complexity. Likewise, when precise numerical comparisons are required, simpler visuals such as bar charts or tables often communicate information more clearly and with less risk of misinterpretation.
Best Practices for Presenting Pareto Charts
A Pareto chart delivers the most value when it is presented with clear guidance. Start by briefly explaining what the chart shows and how to read it, then walk the audience through the most significant contributors. Avoid over-annotating and let the visual do most of the work. Most importantly, connect the insights directly to actions or recommendations to ensure the chart leads to clear, meaningful next steps.
Using PowerPoint Templates to Save Time
For presenters who want a professional look without building charts from scratch, pre-designed PowerPoint templates can be a practical solution. Pareto Chart PowerPoint Templates provide consistent layouts, clean styling, and editable charts, allowing you to focus on analysis rather than formatting.
Final Words
Creating a Pareto chart in PowerPoint is a practical way to transform raw data into meaningful priorities. By combining ranked categories with cumulative impact, Pareto charts help teams focus on what delivers the greatest results. Pareto charts are useful for analyzing quality issues, customer feedback, or operational inefficiencies. A well-designed Pareto diagram turns complexity into clarity, making it easier to decide where to apply effort and resources first. However, you should ensure the chart is not cluttered and that the key data highlights are the focus when presenting the information.
A Pareto chart can make it easy for you to present datasets; however, much of how the data is explained also depends on the way the presenter covers key aspects of the data. You shouldn’t expect the audience to read the data on their own; instead, make the effort to translate the information into a quick overview that covers key highlights for clarity.