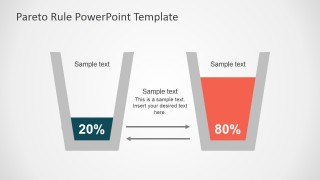
Pareto Principle PowerPoint Template
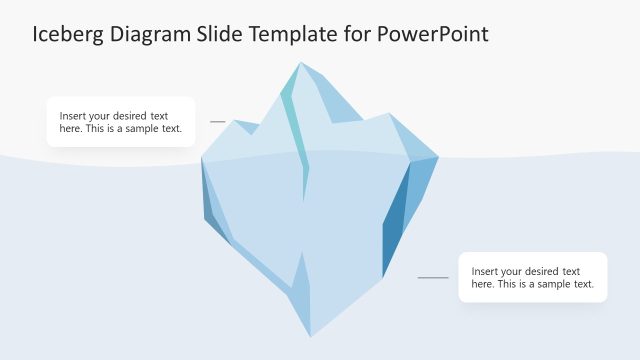
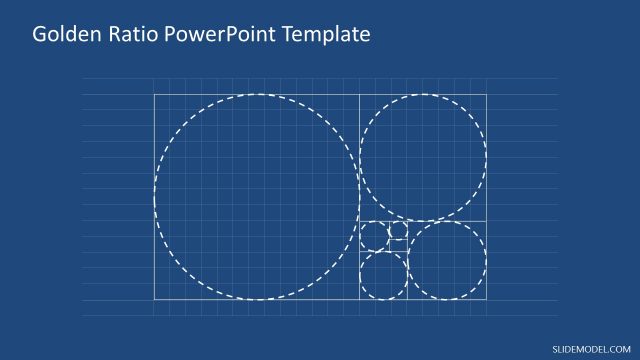
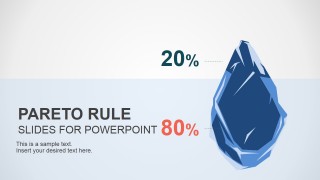
The Pareto Principle PowerPoint Template is a professional presentation featuring different metaphors that describe the 80/20 rule with an iceberg slide. The user can include different metaphors created with PowerPoint Shapes in any presentation that requires the quote or mention of the Pareto principle. The PowerPoint template includes creative clipart and data driven charts that will help the presenter reinforce the 80/20 rules being described.
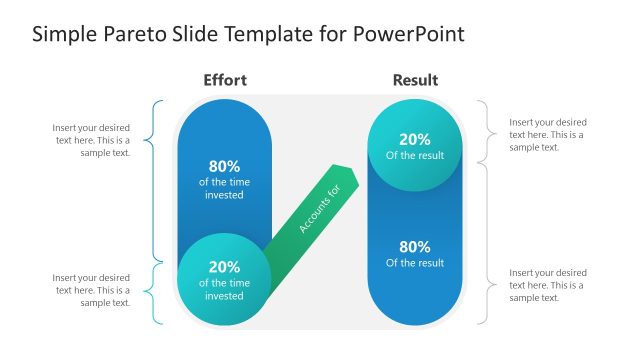
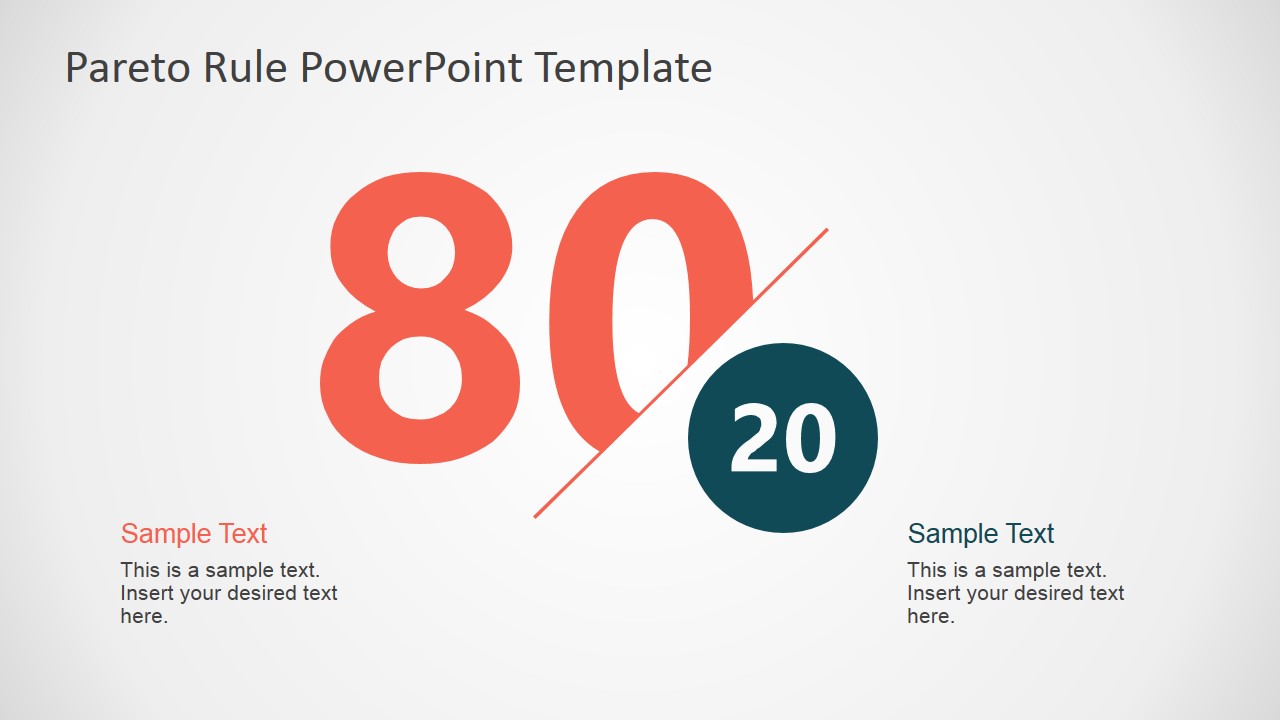
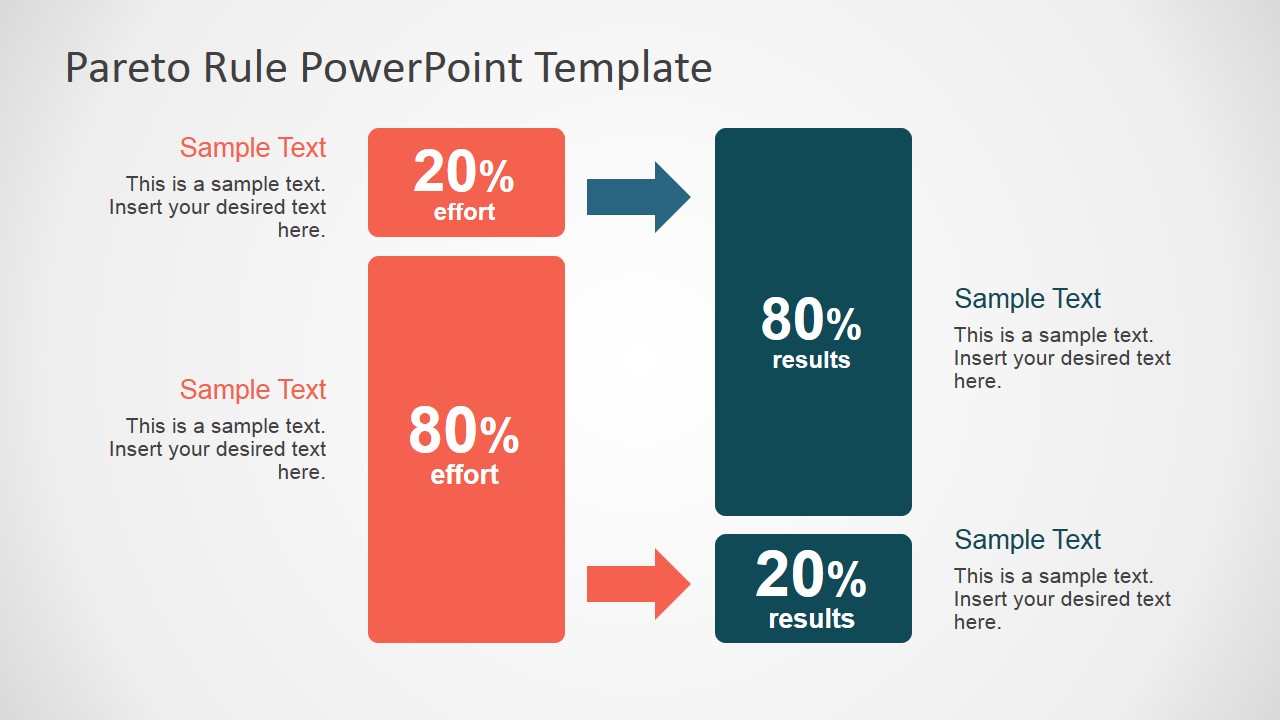
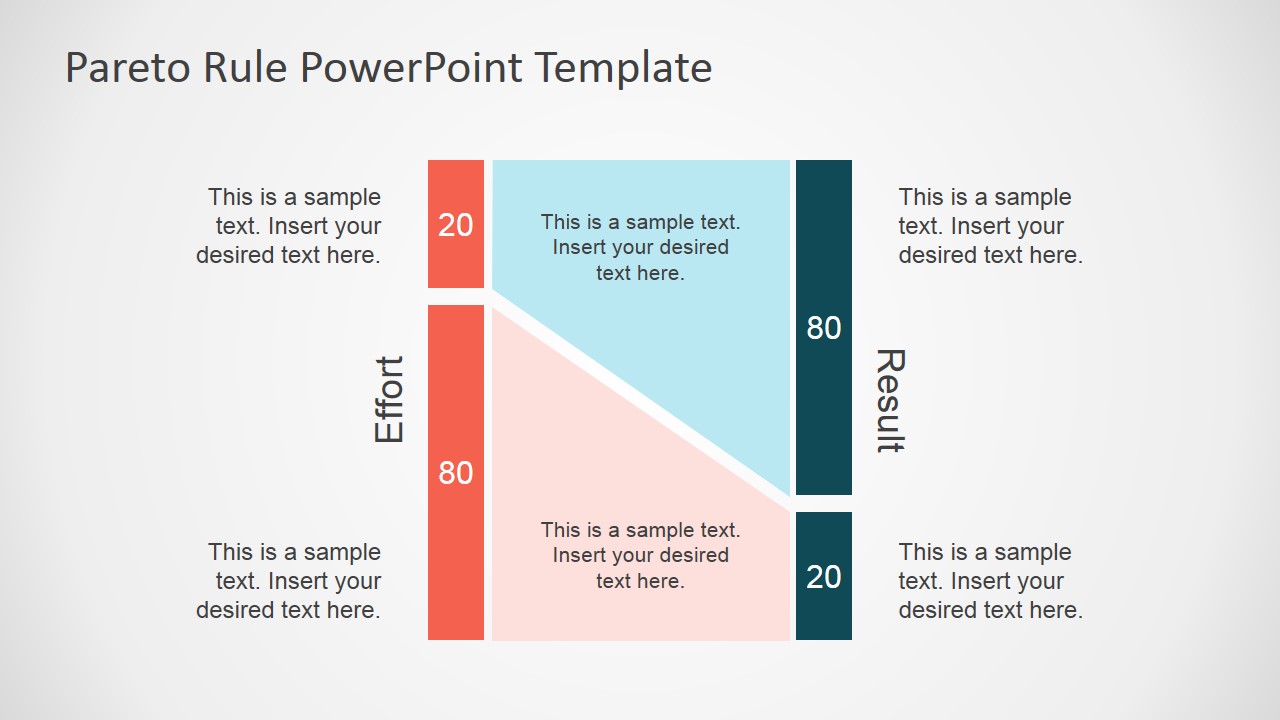
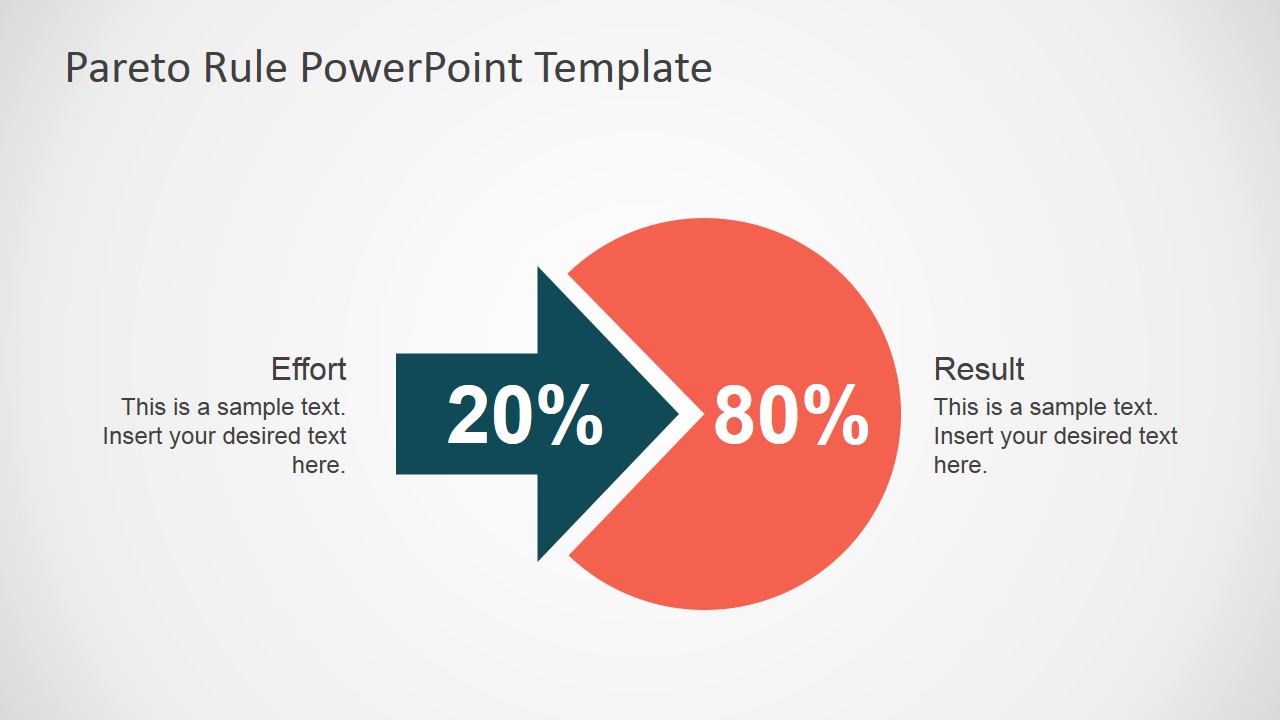
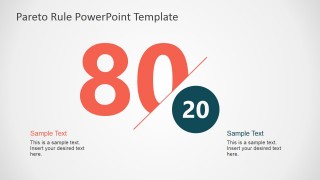
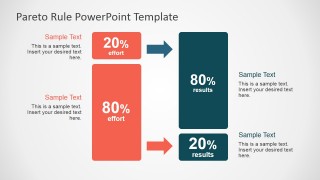
The Pareto principle, also known as the 80/20 rule, is one of the most popular statements used in business. Named after the economist Vilfredo Pareto, who published a famous paper that demonstrated how nearly 80% of Italy land was owned by 20% of the population (at the time of the paper) . The rule states that for many events, near the 80% of the effects are a result from 20% of the causes.
Used as a rule of thumb in business environments, with quotes and statements like:
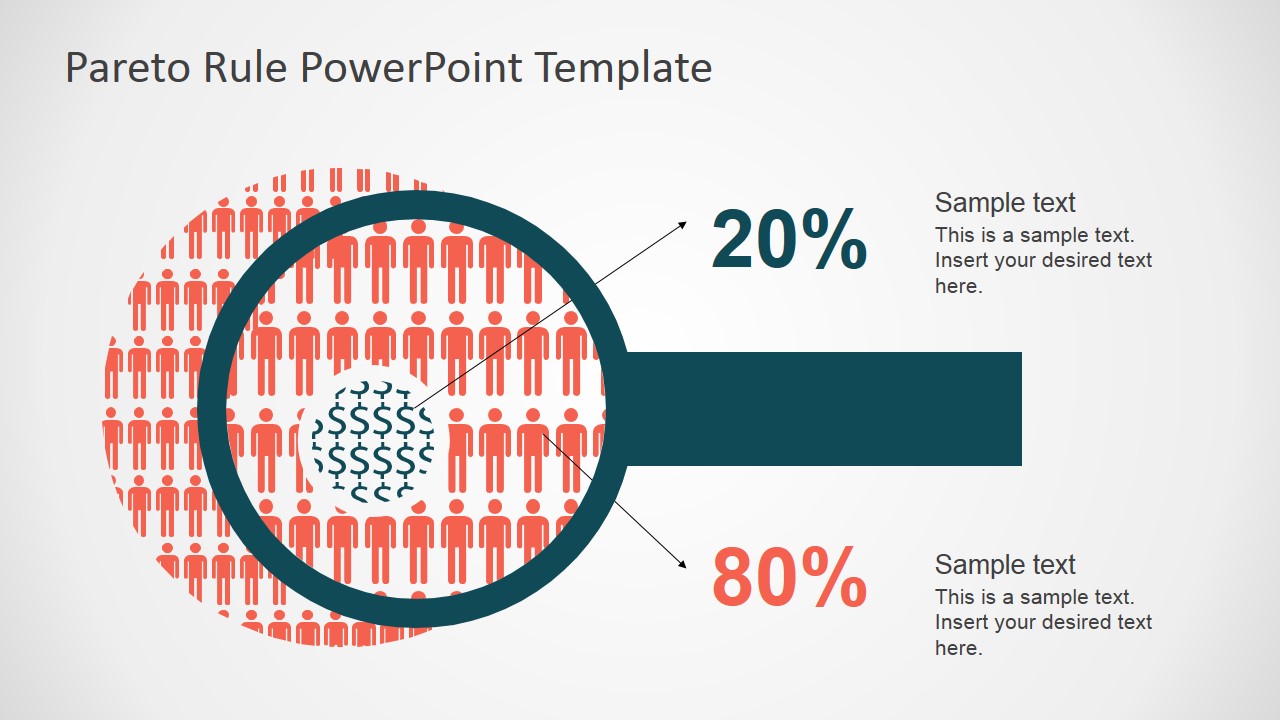
- “..80% of your sales come from 20% of your customers..”
- “..80% of this quality issues are caused by 20% of the steps in the process..”
- “..80% of the price of this products is the effect of 20% of this features..”
- “..80% of your profits will come from 20% of the stocks of your portfolio..”
Managers and Entrepreneurs generally advocate the rule. In scenarios of lack of resources or in need of optimization, focusing in the right causes, expecting the highest return, is considered a best practice. Identifying a pareto qualified scenario might bring high ROI over small changes.
The Pareto principle is not only observational, it follows a mathematical theory called the Pareto Distribution, applicable for a particular set of parameters. Many scenarios and phenomena have shown empirically to exhibit this distribution.
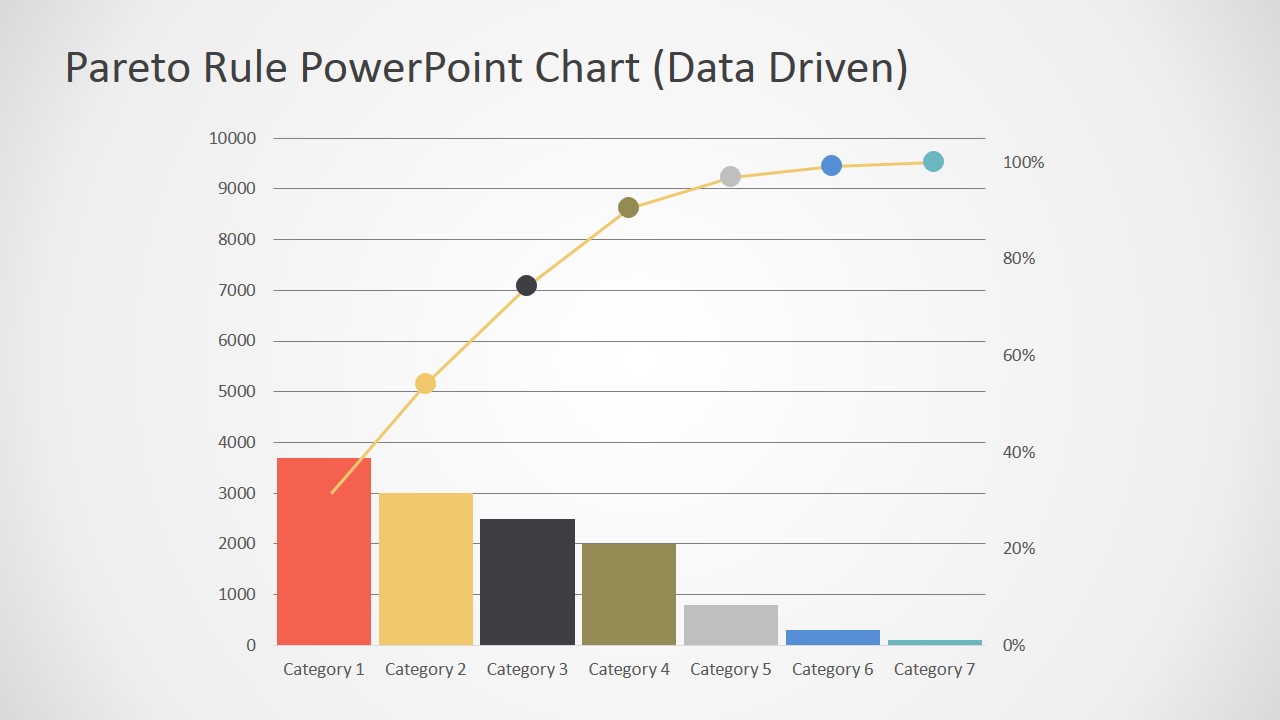
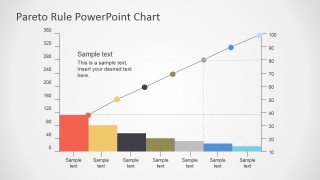
The Pareto principle is also described by the use of the Pareto Chart. This type of chart presents a column chart in the main vertical dimension and a line chart in the secondary vertical dimension. The Pareto Principle slide template provides a static version of this chart and a data-driven version for most sophisticated users that need to create real data charts.
The presentation is created with created with a modern Flat Design and a warm light palette, that can be configured through the PowerPoint Themes feature. Each of the PowerPoint Shapes and Icons are created as PowerPoint objects, allowing the user to fully customize its appearance without loosing any resolution quality.
You can download this template for PowerPoint & Google Slides, or alternatively, download more Pareto PPT templates.


You must be logged in to download this file.
DOWNLOAD- Category
- Shapes
- Rating


 Loading...
- Size
- 16x94x3
- Item ID
- 6982-01
- Colors
Subscribe today and get immediate
access to download our PowerPoint templates.