Many manufacturing companies rely heavily on their supply chain to provide the raw materials and components required to produce their products. The smooth flow of these inputs is critical to production, and the cost can be high when one component fails.
KFC, the fast-food giant, knows this. In 2018, a massive chicken shortage led the fast-food company to close most of its restaurants in the United Kingdom after its logistic partner, DHL, failed to deliver ingredients. This incident serves as a cautionary tale of the severe consequences of supply chain disruptions and the importance of understanding one’s supply weakness to make purchasing improvements.
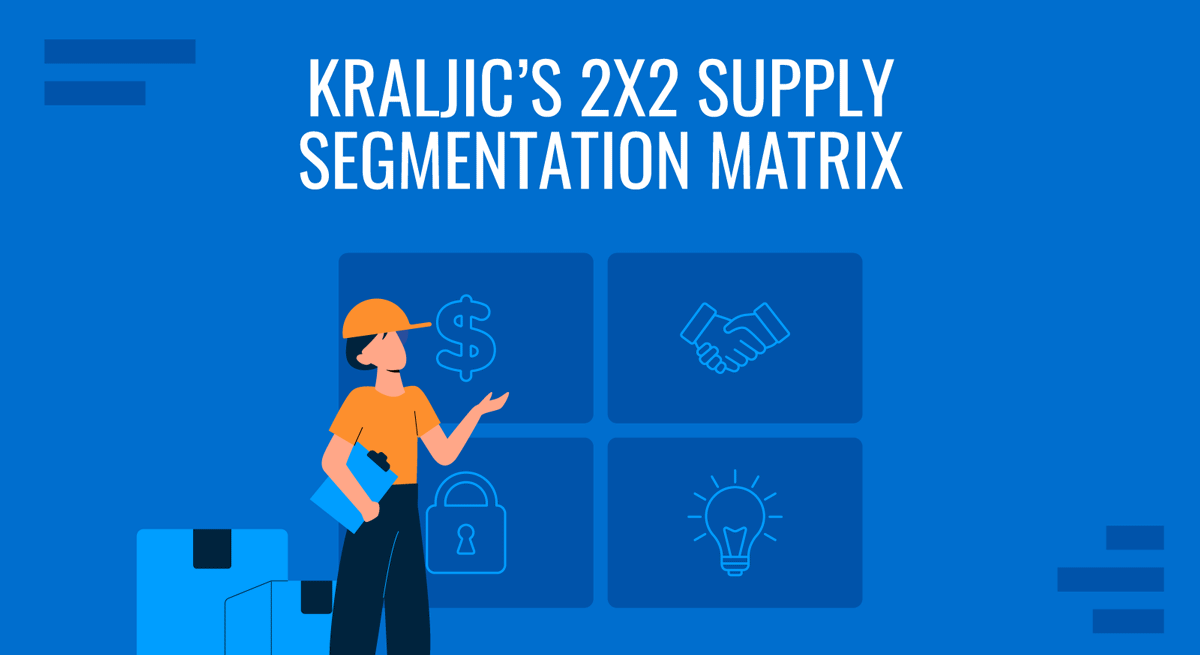
Using the 2×2 supply segmentation matrix (aka The Kraljic Matrix) is one of the many ways companies can understand their supply chain and make the needed adjustments.
Table of Contents
- Why Is Supply Segmentation Important?
- The 2×2 Supply Segmentation Matrix (Kraljic Matrix) Explained
- The Four Quadrants of the Kraljic Matrix
- Implementing the 2×2 Supply Segmentation Matrix in Your Organization
- Real-Life Applications: How Nestle Uses Kraljic Matrix
- Similar Matrix
- Conclusion
Why Is Supply Segmentation Important?
Supply segmentation is the process of identifying how critical a particular input is to your product or service delivery and tailoring your relationship with the suppliers based on their importance.
Key suppliers are critical to the success of your organization and therefore require a high level of engagement and closer focus than other suppliers.
The benefits of supply segmentation can be summed up in three points.
- Improved buying process
- Reduced cost and waste
- Better risk management
Gaining insight into your supply chain will allow you to develop more effective procurement strategies. This can help you negotiate better deals, build stronger supplier relationships, and create more value for your organization.
Focusing your efforts on the most critical suppliers will also allow your organization to allocate its resources to critical components of the business. This can help improve efficiency and reduce waste while ensuring the organization gets the best value from its suppliers.
Lastly, supply segmentation will allow you to anticipate roadblocks in your supply chain, ensuring continuity of supply and reducing the impact of supply chain disruptions when they happen.
The 2×2 Supply Segmentation Matrix (Kraljic Matrix) Explained
Kraljic’s 2×2 supply matrix is a commonly used tool that helps organizations segment their supply based on two dimensions – supply profitability (profit impact) and supply risk.
Supply profitability determines the importance of the supply and its impact on the organization’s operations. For KFC, a large proportion of its profits are determined by DHL’s ability to deliver chicken ingredients on time.
The second factor concerns the complexity of the supply market. This refers to the level of risk associated with the supply of goods or services, considering factors such as supply chain disruptions, geopolitical risks, and changes in demand or supply.
Going back to our case study, KFC choosing DHL as its logistic partner for its chicken ingredient supply is a high-risk decision. DHL has only one distribution center, leaving no contingency plan when the supply or system is down.
The Four Quadrants of the Kraljic Matrix
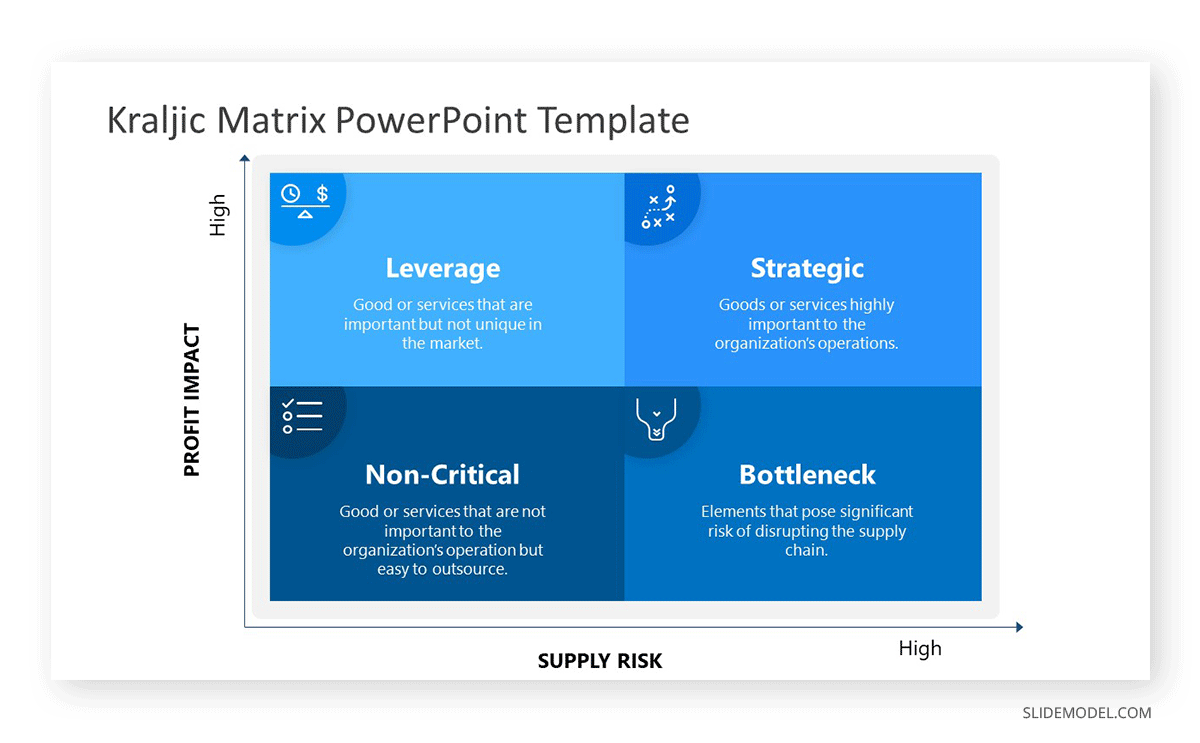
This is what the Kraljic Matrix looks like, classifying the products or supplies as strategic, bottleneck, leverage, and non-critical.
Strategic Supply
Strategic supplies are goods or services that are highly important to the organization’s operations and are sourced from a complex market. Typically, these materials are low in supply, lack alternatives, and are sourced from established global suppliers who control the prices.
For KFC, an example could be the ingredients for their famous fried chicken. This is critical to the quality and consistency of their products and cannot be replaced easily.
Organizations need to establish supply continuity for this product category. Without these components, the organization could not produce its products, which may result in significant lost revenue. Therefore, managing strategic supplies requires a strong relationship with the supplier and working collaboratively to minimize the risk of disruptions.
Organizations should deeply understand the supplier’s business, including its limitations. One way to achieve this is to involve the supplier in regular meetings with key stakeholders to discuss upcoming projects and address any issues or concerns that arise.
Leverage Supplies
Leverage supplies are goods or services that are important but not unique, and there are often several alternative sources available in the market. Since the supply of these items is abundant, the purchasing organizations have the ball during negotiations. They can exploit this by negotiating favorable terms with leverage suppliers, reducing costs, and increasing their profitability.
For restaurant businesses like KFC, beverages could be an example of leverage supplies. They are not part of their core product line, easily replaceable by any brand or supplier, and could generate good profit.
However, leverage suppliers may be less willing to invest in long-term partnerships or collaborative initiatives. So, procurement teams may need to focus on developing strong negotiation skills and exploring alternative suppliers.
Bottleneck Supplies
Bottleneck supplies are the exact opposite of leverage items. Organizations are less likely to profit from them but pose significant risks if there is a disruption in the supply chain. These items are also difficult to replace due to a limited number of alternative sources in the market.
In this scenario, the supplier has the upper hand during negotiations, making it difficult for the companies to negotiate favorable terms or switch to an alternative supplier.
One example of bottleneck items is pizza boxes for a pizza restaurant. It’s very specific to the brand and is not easily replaceable.
To overcome the challenges with this supply type, organizations could develop long-term partnerships with suppliers to ensure continuity of supply. They could also diversify their supply sources where possible to reduce dependence on a single supplier.
Non-critical Supplies
Non-critical supplies are goods or services that are not important to the organization’s operations and are easy to source. They are commodity-type items that organizations use on a daily, but their absence doesn’t pose a serious threat to the operations.
Examples of non-critical supplies are cleaning and sanitation supplies, such as detergents, mops, and paper towels. Although they are essential for maintaining cleanliness and hygiene, they are readily available from multiple sources in the market.
Purchasing teams can redirect responsibilities and streamline the procurement processes of these items. One way of doing this is by maintaining a procurement catalog that employees can use to select items they need without the lengthy procurement process.
Implementing the 2×2 Supply Segmentation Matrix in Your Organization
Define the importance of supplied goods or services.
The first step of segmenting your supply chain is to determine how critical the supplied goods or services are to your business operations and how much impact their quality, availability, or cost has on your bottom line.
Are the inputs part of your core product line, or are they consumables that customers don’t see? Do you make a significant profit from them? These questions you’d be asking to determine how critical a component is to your operations.
If your answers are yes, the supplied goods should take the top layer of the matrix.
Assess the complexity of the supply market.
Evaluate the level of complexity in the supply market for each product or service, considering factors such as supplier concentration, supply chain risk, and market volatility.
To start, answer the following questions:
- Are the supplied goods have limited availability?
- Does the supplier have bargaining power?
- Are there any barriers to entry into the market, like regulatory factors?
If you answered yes, the supplied goods in question have a high-risk factor of experiencing a disruption or other negative impacts in the supply chain.
Plot your suppliers on the matrix
Use a 2×2 matrix with the importance of supplied goods or services on the x-axis and the complexity of the supply market on the y-axis. Plot each supplier on the matrix based on their importance and market complexity.
- If the supplied goods are important to your organization and from a complex market, they should go inside the 4th quadrant or the strategic supply.
- Goods important to your organization but not risky should go inside the 3rd quadrant or the leverage supply.
- Low-profit supplies with complex market fall inside the 2nd quadrant or the bottleneck.
- All low– profit non-essential products with efficient supply should go inside the 1st quadrant or non-critical.
Define procurement strategies for each quadrant
Develop customized procurement strategies for each quadrant based on the characteristics and importance of the suppliers in that quadrant. Use the tips we shared above to identify each matrix quadrant’s procurement approaches and supplier relationships. You may also use an editable template to visualize them.
Present the Matrix Using PowerPoint
Finally, present the 2×2 matrix to stakeholders using PowerPoint and communicate the results of a supply chain analysis. By visualizing the matrix, you can help stakeholders understand the different categories of supplies and the associated risks and opportunities.
If you are having trouble with the design of your slide, using an editable PowerPoint template for presenting the Kraljic matrix can be a time-saving solution. A template provides a pre-designed layout and format for the presentation, which can help to ensure consistency and coherence throughout the slides.
Real-Life Applications: How Nestle Uses Kraljic Matrix
Let’s look at the practical applications of the Kraljic Matrix to Nestle’s supply chain.
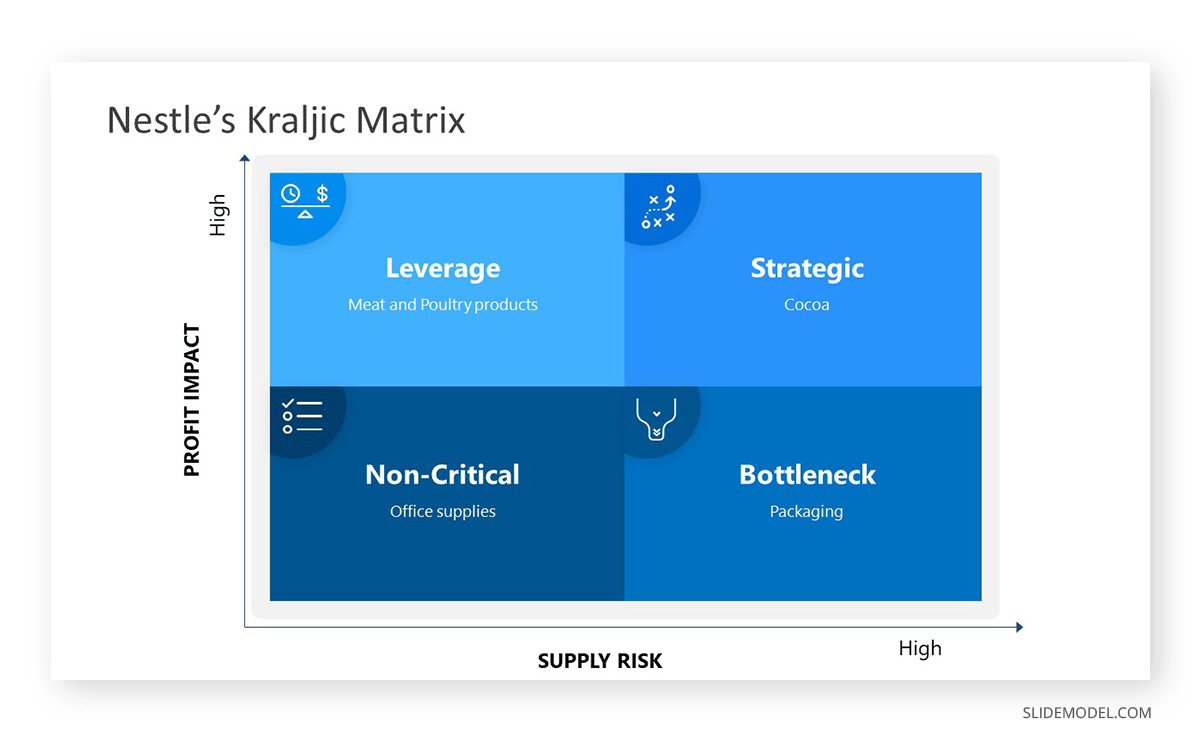
Cocoa is a key ingredient in many of Nestle’s confectionery products. However, it faces several supply challenges for this input, citing deforestation and low incomes for cocoa farming as some of the reasons.
To manage this critical item, Nestle has developed a strategy to work closely with its cocoa suppliers to create a sustainable cocoa supply chain at a fair price. This includes investing in sustainable cocoa farming practices, which help secure their cocoa supply and ensure that the cocoa is produced in an environmentally and socially responsible way.
Meat and poultry products fall under Nestle’s leverage supplies. These products are generally easy to source, so the company sets strict standards that its suppliers must comply with. They also diversify the suppliers for these items, sourcing products from the U.S., France, Germany, and Spain.
Packaging is a bottleneck supply for Nestle, as it is critical to the production and transportation of its products, but it can also be difficult to secure in sufficient quantities. There are also environmental sustainability challenges, and Nestle’s strategies to address these are to scale on their reusable and refillable systems and design recycled packaging materials.
As with many companies, Nestle’s non-critical supplies include office supplies, such as paper, pens, and IT equipment, such as computers and software. These items are important for Nestle’s operations but are not critical to the production of its products. As a result, Nestle manages these items through a more transactional approach, such as standardized purchasing processes and e-procurement, to reduce costs and improve efficiency.
Similar Matrix
The ANSOFF Matrix Strategy
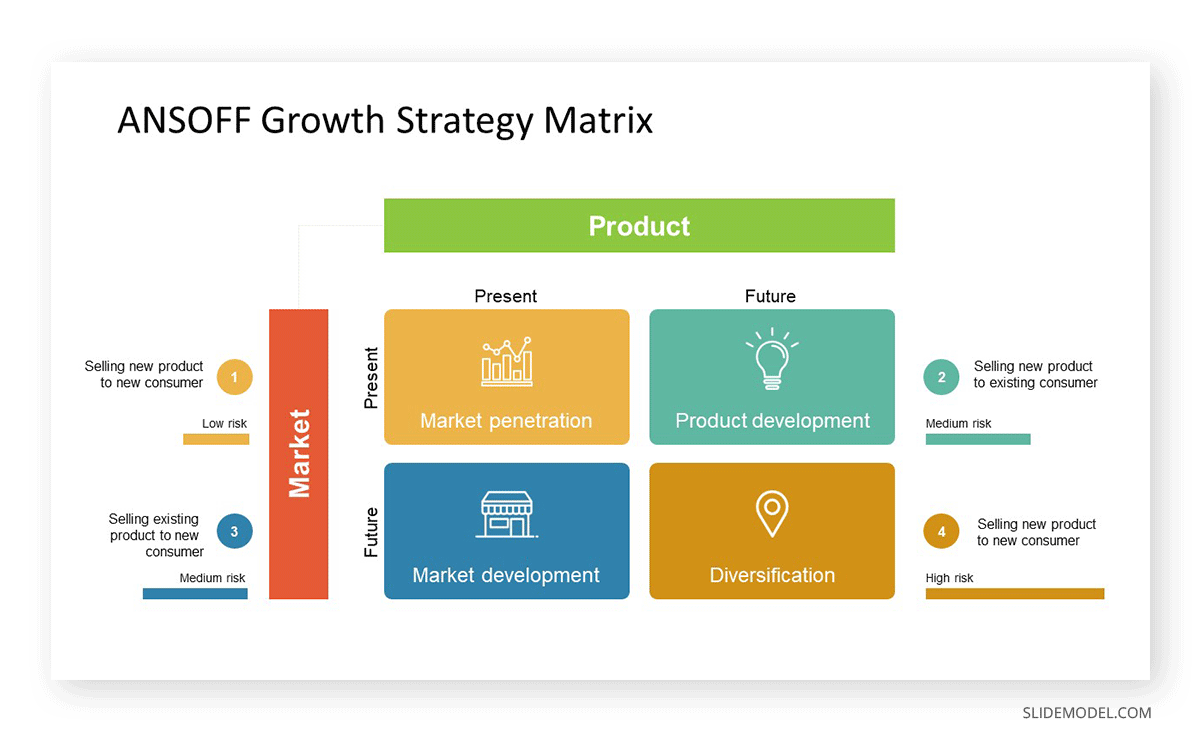
Ansoff Matrix is a strategic planning tool that helps organizations identify growth opportunities (Market Penetration, Market Development, Product Development, Diversification) by analyzing potential combinations of products and markets.
Supply Preference Model
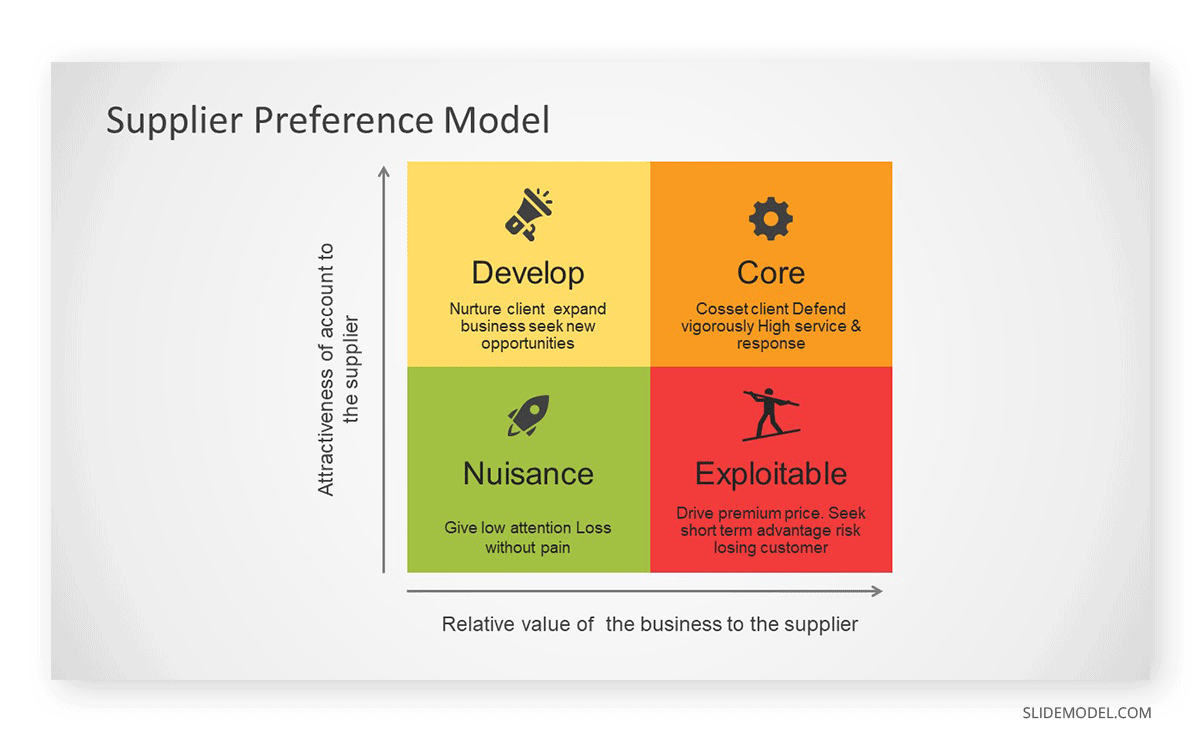
The supply preference model is the graphic presentation of procurement concepts based on several criteria: quality, cost, delivery, and service. This model helps organizations prioritize their supply chain activities and select suppliers that best meet their needs and requirements.
Supply Positioning Model
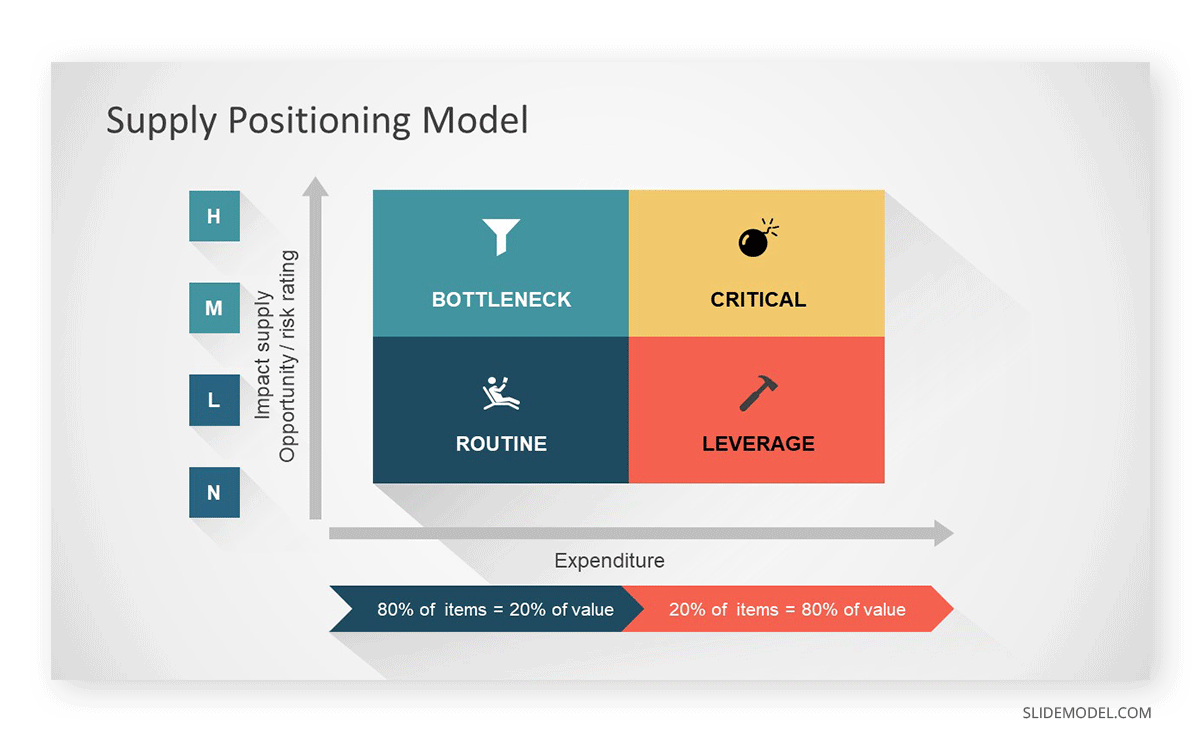
The Supply Positioning Model is a tool organizations use to evaluate and position suppliers based on their strategic value and importance to the organization. This model helps organizations identify the key suppliers that impact their operations most and prioritize their resources accordingly.
Conclusion
Understanding your supply chain and segmenting your suppliers can help improve your buying process, reduce costs and waste, and better manage risks.
As seen in the case of KFC’s chicken shortage, companies can suffer significant financial and reputational damage if they fail to manage their supply chain effectively. Therefore, it is crucial for organizations to regularly review and assess their supply chain strategy to ensure continuity of supply and minimize the risks of disruptions.