Many people require presenting an organizational chart (organogram) in presentations. This often means recreating organizational charts in slides because other document formats can be challenging to integrate into presentations. Some individuals also prefer creating organizational charts in presentation apps, especially when they are not adept at using graphic design applications. In a previous post, we showed you how to create an org chart in PowerPoint. In this post we will show you how to make an org chart in Google Slides.
How to Create Org Chart in Google Slides
Various methods, including hierarchy diagrams, shapes, and templates, can be used to create an org chart in Google Slides.
Method 1: Create an Org Chart in Google Slides using Diagrams
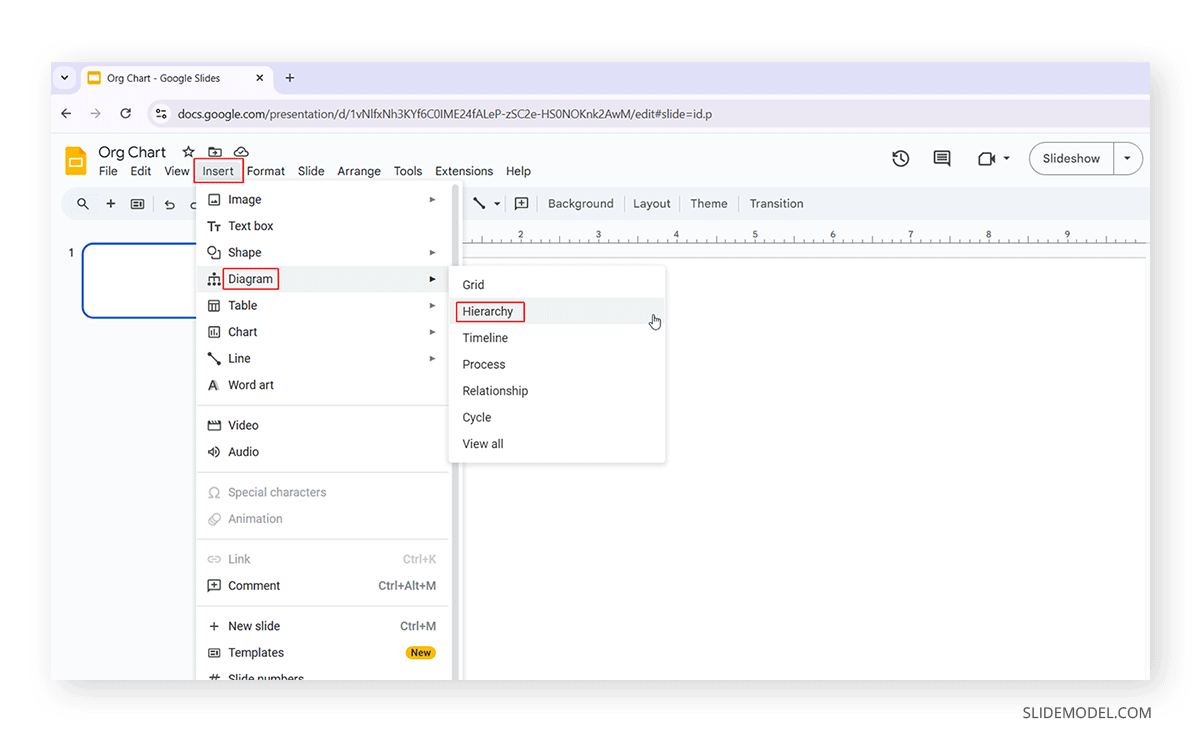
Step 1- Insert Hierarchy Diagram: One of the easiest methods for creating an org chart in Google Slides is using diagrams. You can start by inserting a hierarchy diagram via Insert -> Diagram -> Hierarchy.
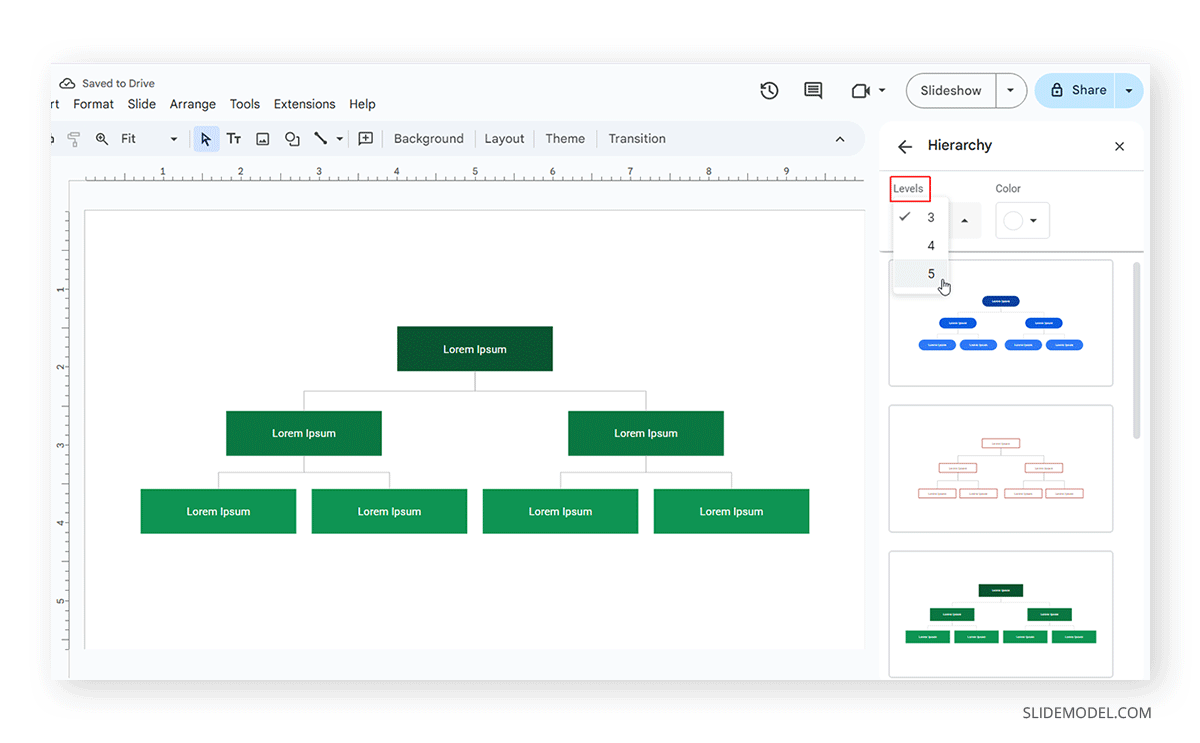
Step 2 – Define Levels: You can instantly select a hierarchy diagram to insert in Google Slides from the right sidebar, which will appear once you open it via the Insert menu. You can also select the levels for the diagram before inserting it to ensure you have the right number of columns to use. These levels can be edited to remove sections at a time.
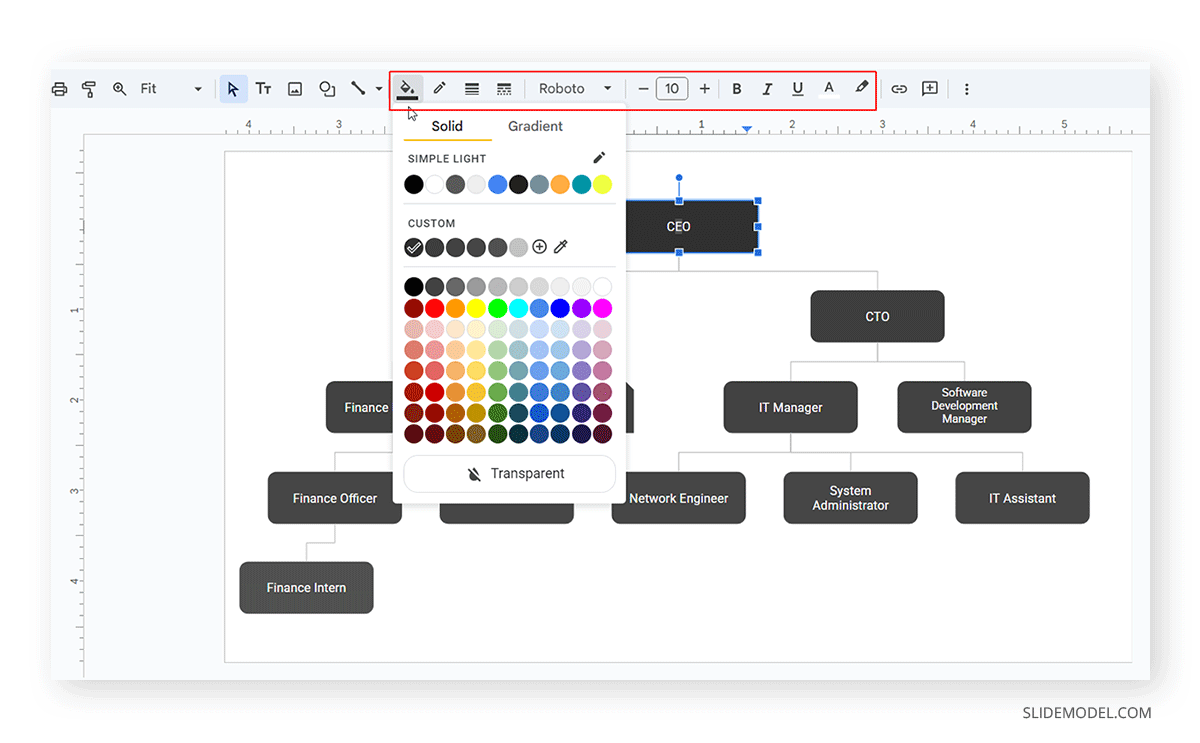
Step 3 – Select Org Chart Color: You can select numerous color schemes for your org chart in Google Slides before inserting it from the right sidebar.
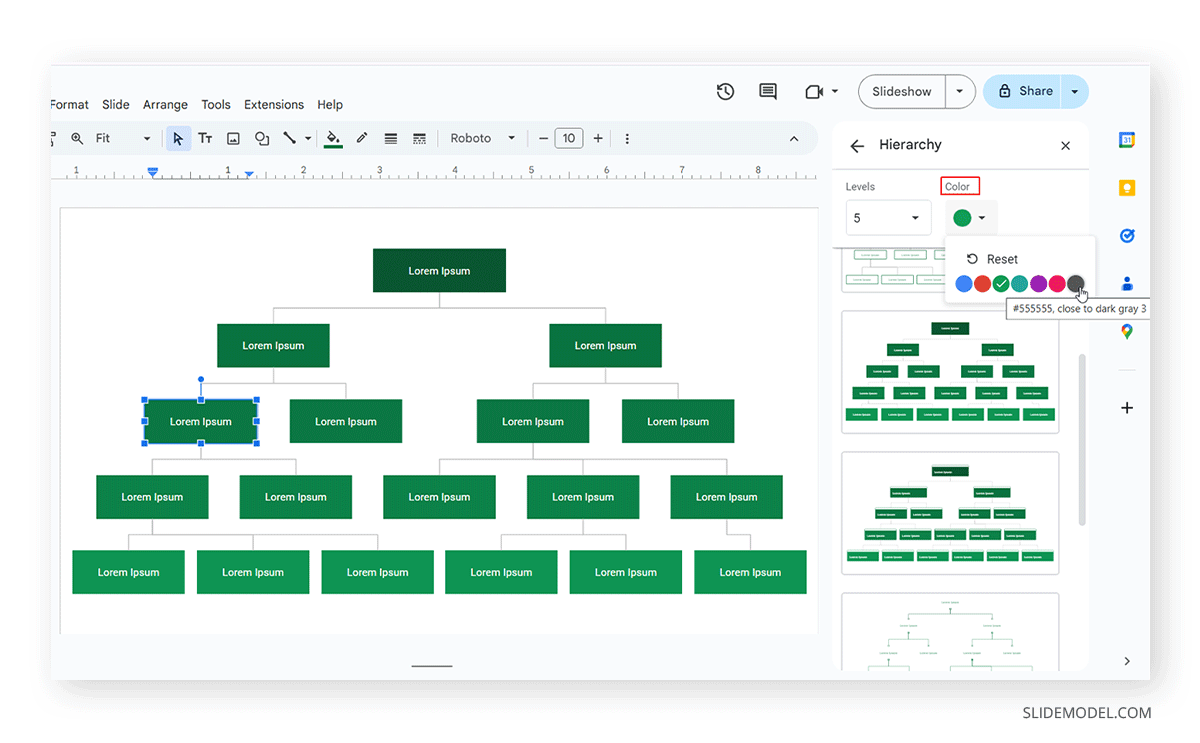
Alternatively, you can add the chart and then use Shape Fill to change the color of the different sections of the chart. You can also use the Google Slides toolbar to edit the org chart diagram’s text, font size, outline colors, shape, etc.
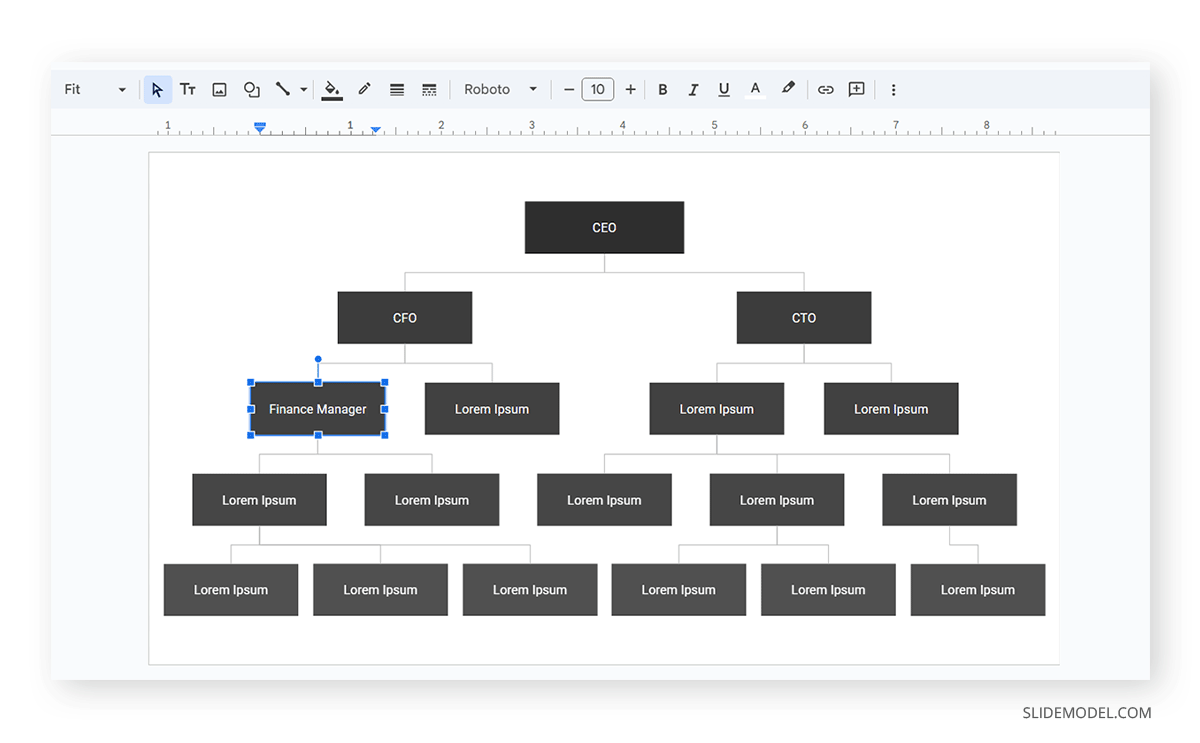
Step 4 – Create the Org Chart Hierarchy: You can create the hierarchy in the org chart by adding titles or names of individuals to build your chart. Simply remove the sample text with the required hierarchy in the chart diagram.
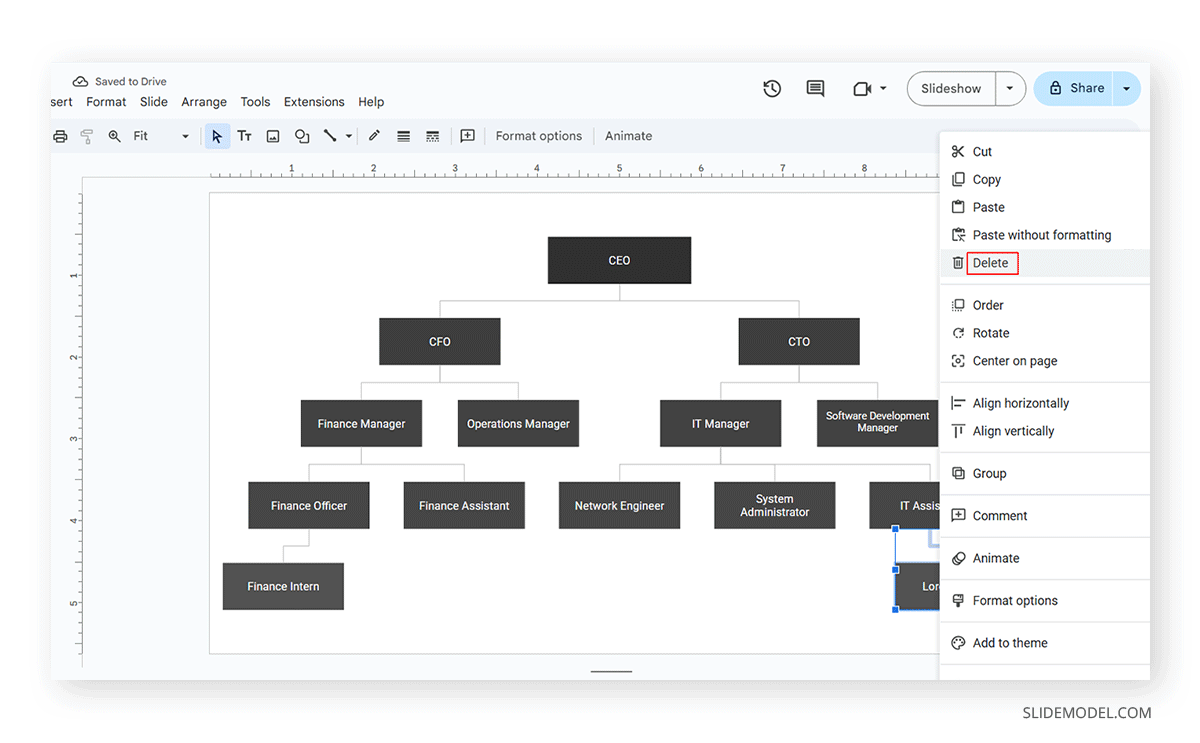
Step 5 – Make Your Org Chart Consistent: The various parts of the org chart diagram can be edited to remove, copy, or reorder sections according to need. You will find many useful options to do this via the right-click context menu.
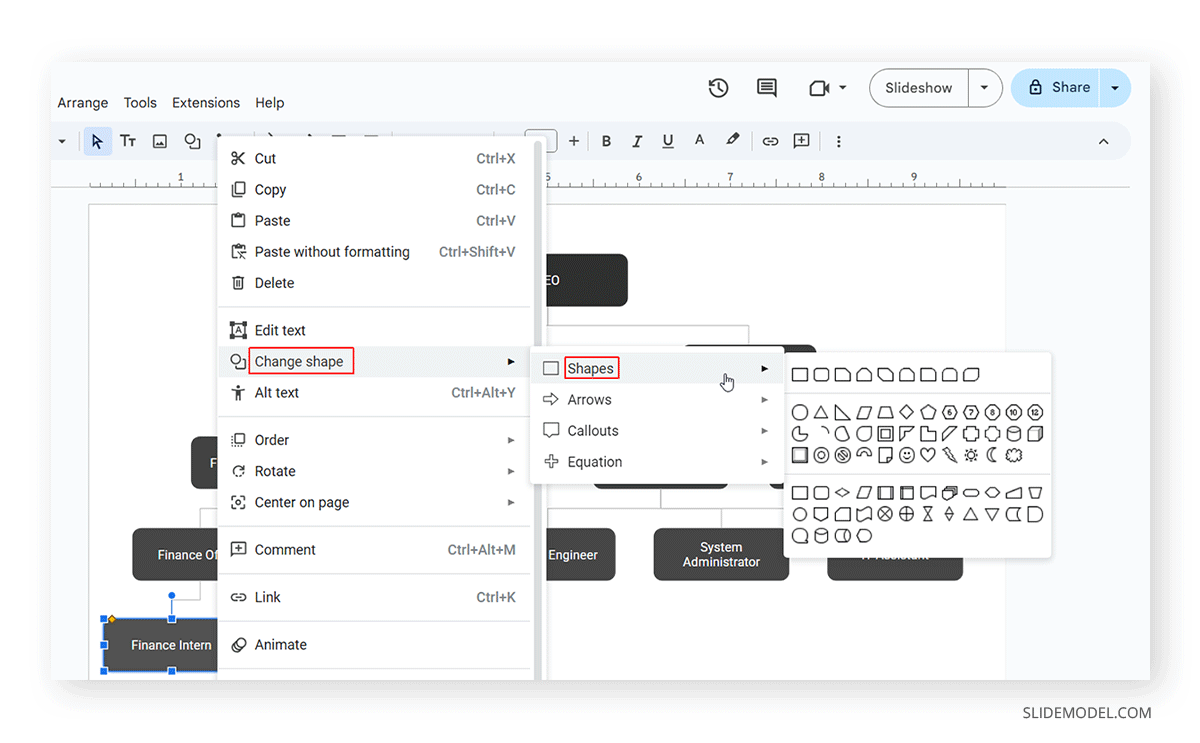
You can even change the space of one or more sections in the org chart via Change Shape -> Shapes from the right-click context menu. While most org charts use one consistent shape, some even change the shape for specific designations to differentiate them. For example, some org charts use rectangles for regular employees, diamonds for decision-makers, and circles for individuals in advisory roles.
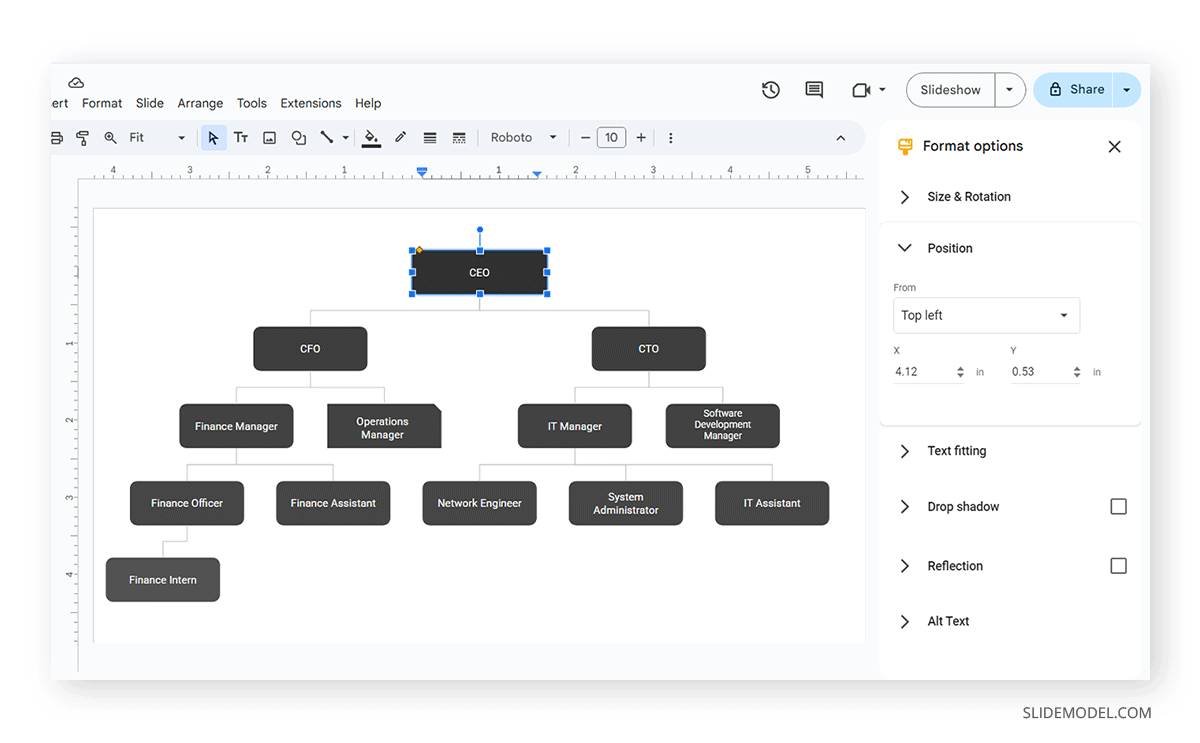
Step 6 – Format Org Chart: By going to Format Options from the right-click menu, you can format the organizational chart by managing its size, position, text, etc. As mentioned, the Google Slides toolbar provides various options for adjusting the org chart’s font, colors, and overall look.
Depending on your needs, you can edit the base diagram to add or remove sections. To make comprehensive changes to the diagram, you can use shapes or create the entire diagram using them, as explained in the next section.
Method 2: Create an Org Chart in Google Slides using Shapes
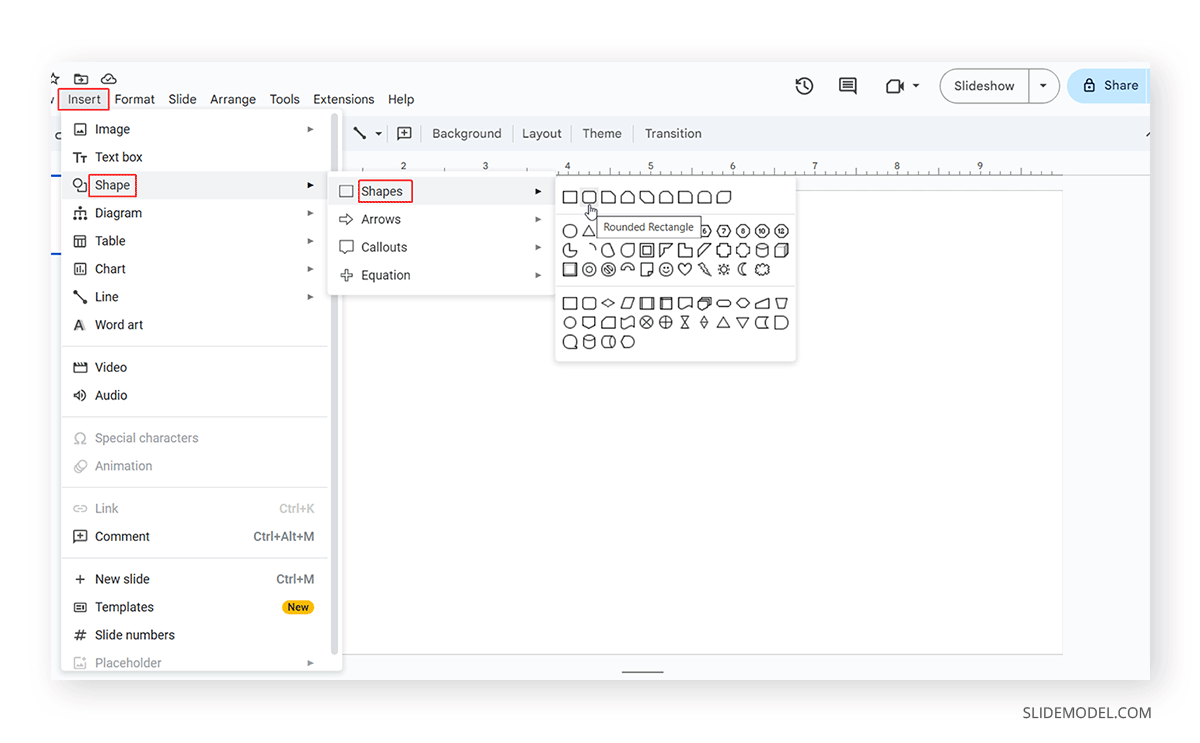
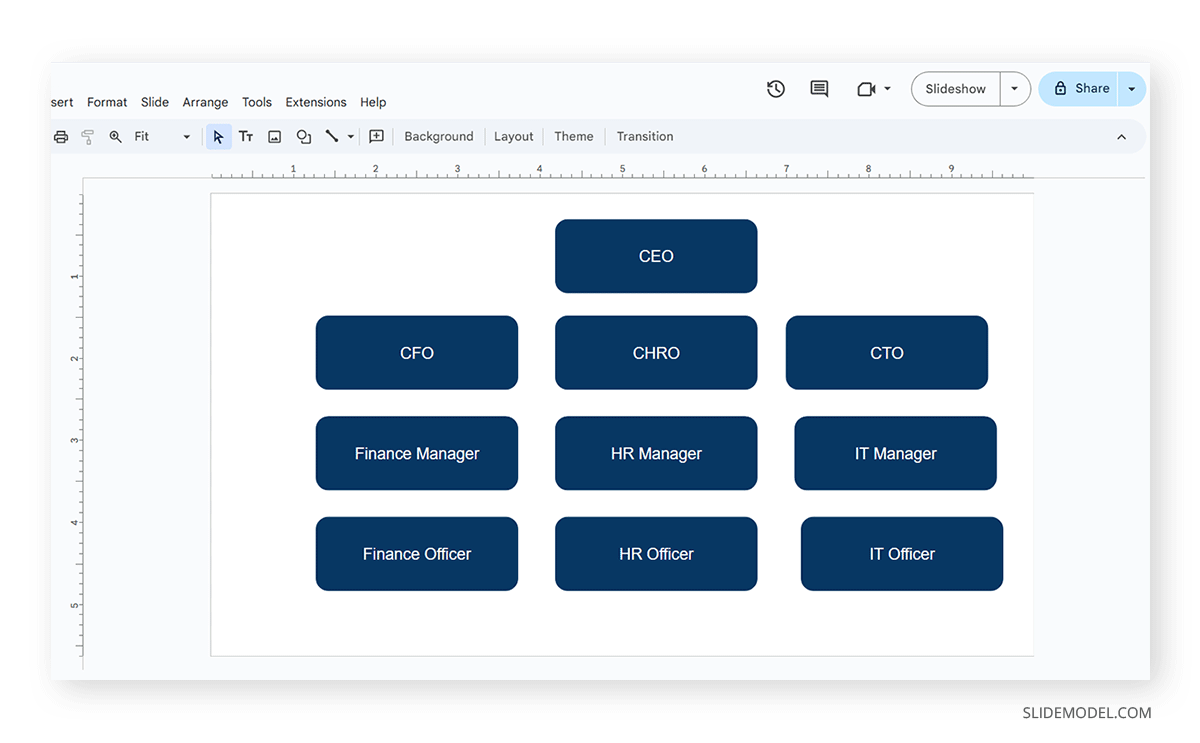
Step 1 – Insert Shape in Google Slides: To create an org chart in Google Slides using shapes, go to Insert -> Shape -> Shapes and select a shape to make your diagram. In this example, we will use rounded rectangle shapes to create an org chart.
Step 2 – Position the Shape on the Slide: Position the shape on the slide to start building your org chart.
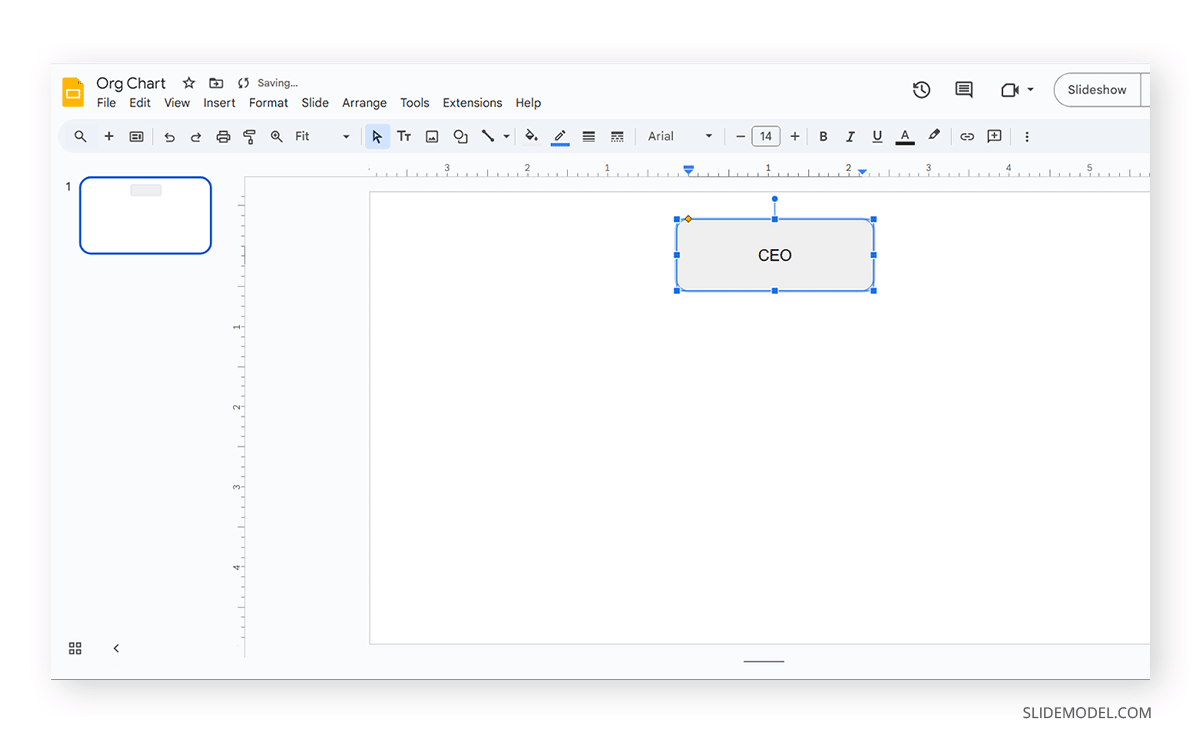
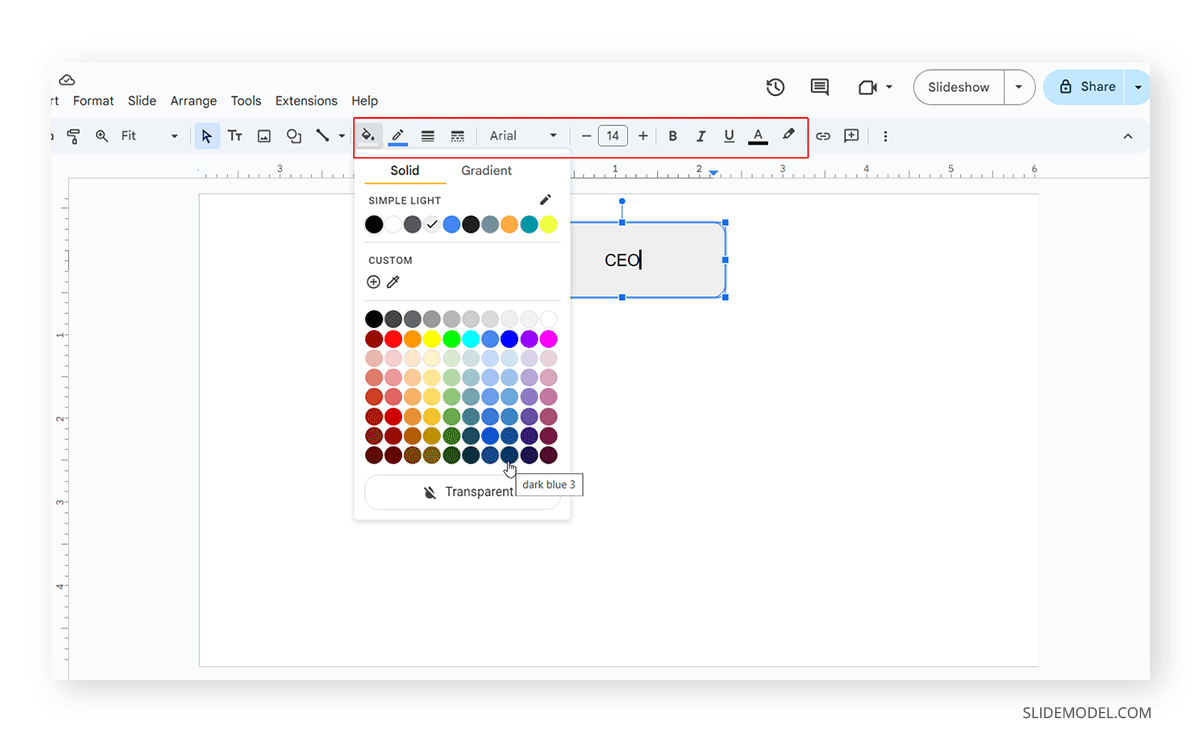
Step 3 – Format Shape: Format shape using the Google Slides toolbar to add a color to the shape and adjust its font, font size, and overall shape design.
Step 4 – Duplicate Shape to Create Hierarchy Levels: Duplicate and add relevant text to create your org chart layout. You can copy the shape via CTRL/Command+C and paste it via CTRL/Command+V or use the CTRL/Command key to drag the shape to duplicate it using the left mouse click.
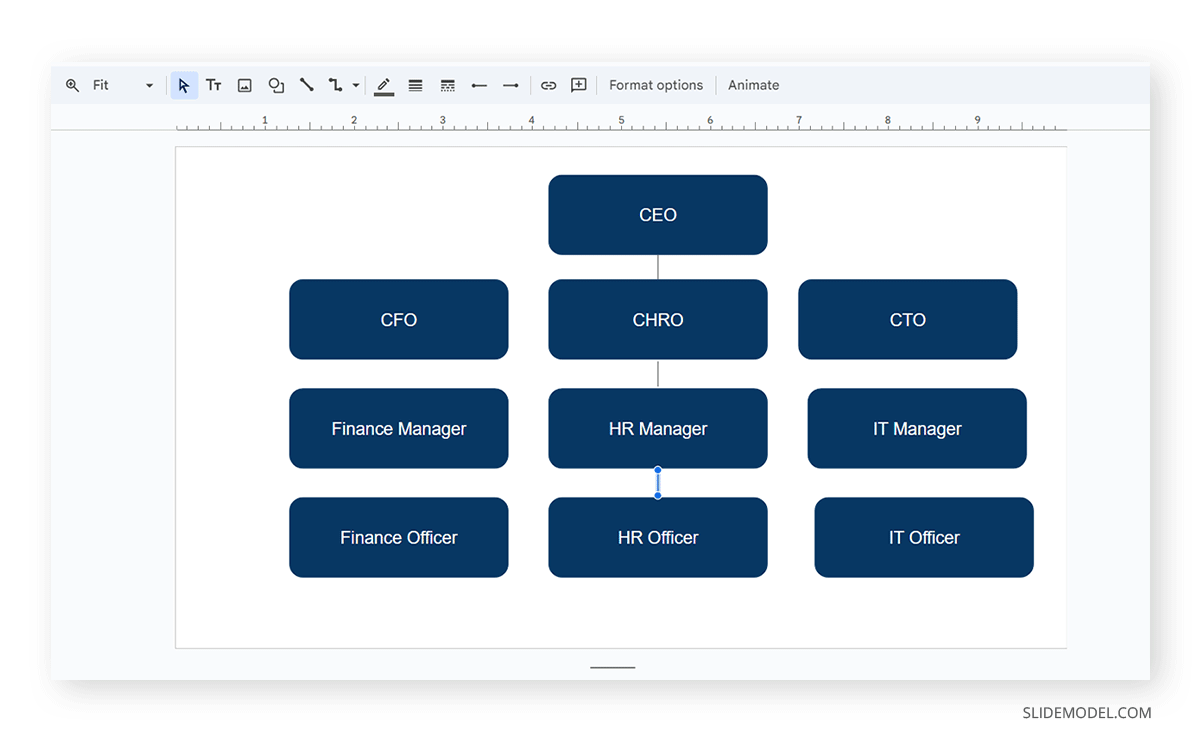
Step 5 – Add Lines to Connect the Hierarchy: To connect the hierarchy, use lines via Insert -> Line -> Line.

Straight lines can help define the org chart hierarchy vertically or horizontally. Connectors can connect top-level sections such as various departments and departmental heads.
You can add a connector via Insert -> Line. In this example, we will use an Elbow Connector to connect the top-level hierarchy in the org chart.
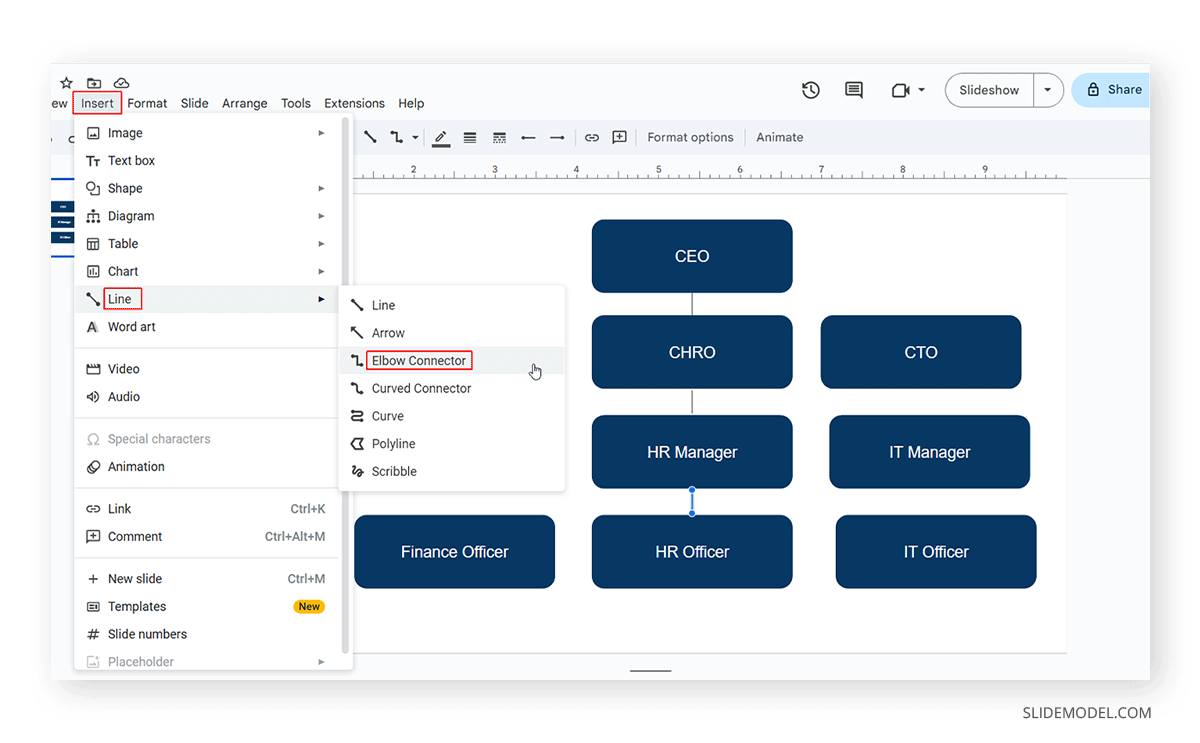
Using an Elbow Connector, Curved Connector, or Curve shape, you can connect the departments and departmental heads to add consistency to your organizational chart. Connector lines make the chart easier to present and read, allowing you to see its various connections.
Method 3: Use Org Chart Templates
By using org chart Google Slides templates or Org chart PowerPoint templates in Google Slides, you can quickly create and present org charts. Org chart templates, specifically for Google Slides or PowerPoint templates, can provide layouts to answer key questions, such as how to start a presentation or end a presentation when presenting an organizational chart.
The below list contains recommendations for the best org chart templates. These templates provide easy layouts for creating org charts and present different chart layers as individual slides.
FAQs
What is an organizational chart, and why create one in Google Slides?
An organizational chart, org chart, or organogram visually represents an organizational structure. It shows the hierarchy of an organization and is often presented as a presentation or single slide. Presentation apps such as Google Slides can create a slide or presentation with an org chart and other related details.
Can you create an organizational chart using Google Slides?
You can create an org chart in Google Slides by inserting a hierarchy diagram via Insert -> Diagram.
Can I manually create an org chart instead of using pre-designed diagrams?
Yes, you can manually use Shapes in Google Slides to create org charts. For this purpose, you can include specific shapes, such as rectangular shapes, via the Insert tab and add lines to show the relationship between different roles in the chart.
Can I use images or logos in an org chart?
You can insert images or logos in an org chart via Insert -> Image.
How can I style my org chart in Google Slides?
To style or format your chart in Google Slides, select the shape in the chart and use the options on the toolbar to change the shape color, shape border color, font, font size, line weight, etc. You can also use drag and drop to resize chart objects and access Format Options via the right-click context menu for size, rotation, position, text fitting, and other formatting options.
Final Words
When designing org charts for presentations in Google Slides, it’s best to focus on simple slides with elements that can stand out. The overall structure and colors should make it easy for the audience to understand the org chart. Furthermore, you should consider questions like how to make a presentation with an org chart engaging by showing different departments, employee profiles, and other relevant details in individual slides. This can help you create an engaging presentation since it will include the complete organogram and other information that might be relevant to the audience.