Slide 7 of 8 from Free Flat Elements for PowerPoint Infographics
Statistical Analysis and Reporting Template Bars
Bar Chart with Percentages for Presentations
- Chart
- Bar Vertical
- Evaluation Slide
- 16:9
- 100% Editable
The Bar Chart with Percentages slide from the Free Flat Elements for PowerPoint Infographics template offers a clear visualization of performance metrics and market comparisons. This slide layout features editable shapes and vector icons to highlight statistical trends effectively, making it a practical choice for business presentations and pitch deck templates focused on data analysis.
What’s on This Slide
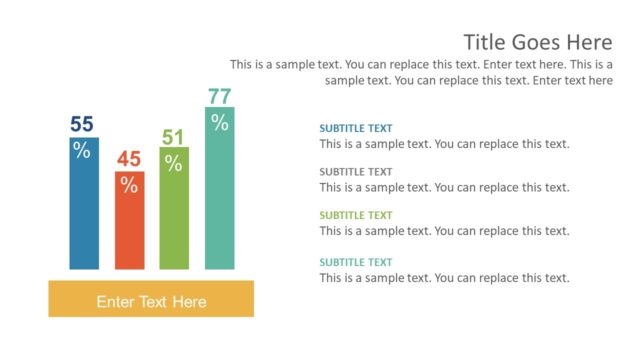
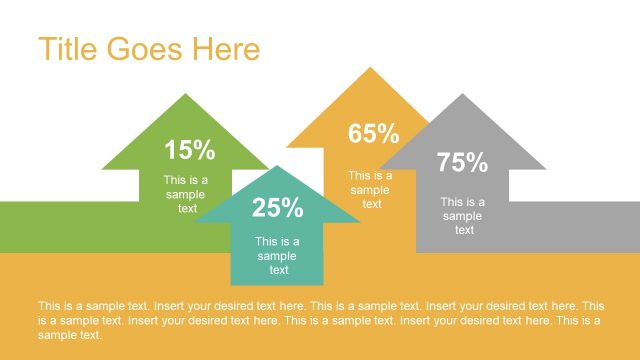
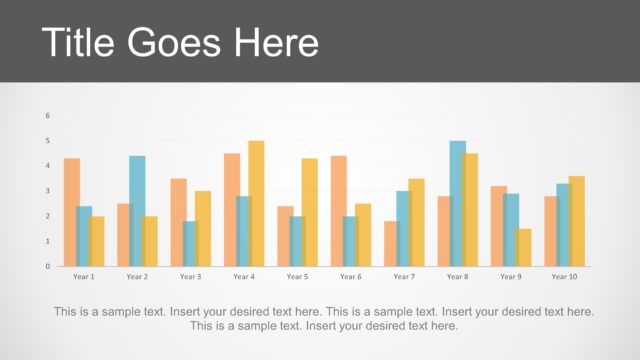
The layout features a vertical bar chart positioned centrally, with four bars of varying heights representing percentages. The tallest bar is on the right, colored red, followed by a gray bar, a yellow bar, and a blue bar on the left. Each bar has an upward or downward arrow icon above it, indicating trends. Below the bars, there are upward-pointing arrows with percentage labels. Text placeholders are aligned to the right of the chart, with a title placeholder at the top. The overall composition is balanced, with a white background enhancing visibility.
How to Use It
This layout serves as a data visualization tool, ideal for presenting statistical comparisons or trends. It fits well in a presentation sequence after problem identification and before strategic recommendations. Scenarios include performance analysis, market research findings, or financial metrics. The structure allows for clear communication of key data points, making it suitable for business meetings or reports.
Text Placeholders & Capacity
Keep your copy within these limits so it fits without resizing. Body slots can accommodate approximately 30-40 words each.
| Placeholder | Count | Max characters (approx.) |
|---|---|---|
| Slide title | 1 | 30 |
| Item heading | 4 | 5 |
| Item body | 4 | 50 |
| Body paragraph | 3 | 150 |
Slide Keywords
Download unlimited PowerPoint templates, charts and graphics for your presentations with our annual plan.
DOWNLOAD