Slide 8 of 8 from Free Flat School Designs PowerPoint Template
Bar Chart School Design PowerPoint
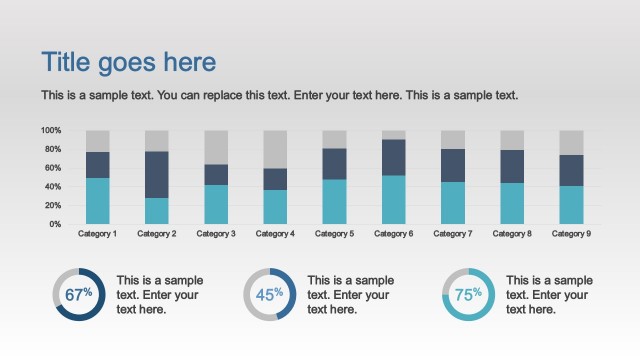
Bar Chart with Percentages for Presentations
- Chart
- Bar Vertical
- Evaluation Slide
- 16:9
- 100% Editable
The Bar Chart with Percentages slide from the Free Flat School Designs PowerPoint Template offers a clear and editable slide layout ideal for presenting performance metrics and statistical comparisons in business presentations or educational reports. This slide integrates a vertical bar chart with editable shapes and color-coded data points, enhancing the visualization of key figures within a corporate presentation or pitch deck template.
What’s on This Slide
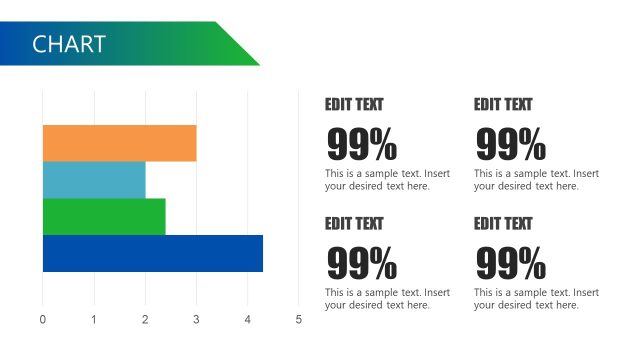
The layout features a bar chart on the left side, displaying four vertical bars in varying heights representing percentages: 55%, 45%, 51%, and 77%. Each bar is a different color: blue, orange, green, and teal. The chart is accompanied by a title placeholder at the top center, with additional subtitle placeholders below each bar. A large text placeholder is located at the bottom center for further details. The overall composition is balanced, with the chart taking up the left half and text placeholders on the right.
How to Use It
This layout serves as a data visualization tool, ideal for presenting comparative statistics or performance metrics. It fits well in a presentation sequence after discussing key findings or results. Suitable scenarios include educational presentations, business performance reviews, or project updates where quantitative data is emphasized. The layout allows for clear communication of numerical data through visual representation.
Text Placeholders & Capacity
Keep your copy within these limits so it fits without resizing. Body slots can hold approximately 20-25 words each.
| Placeholder | Count | Max characters (approx.) |
|---|---|---|
| Slide title | 1 | 100 |
| Subtitle | 4 | 100 |
| Body paragraph | 1 | 200 |
Slide Keywords
Download unlimited PowerPoint templates, charts and graphics for your presentations with our annual plan.
DOWNLOADReturn to Free Flat School Designs PowerPoint Template.