Slide 17 of 21 from Free Flat Business Process Diagram PowerPoint Template
PowerPoint Data-driven Multiple Bar Chart
Bar Chart Presentation Slide
- Chart
- Bar Vertical
- Evaluation Slide
- 16:9
- 100% Editable
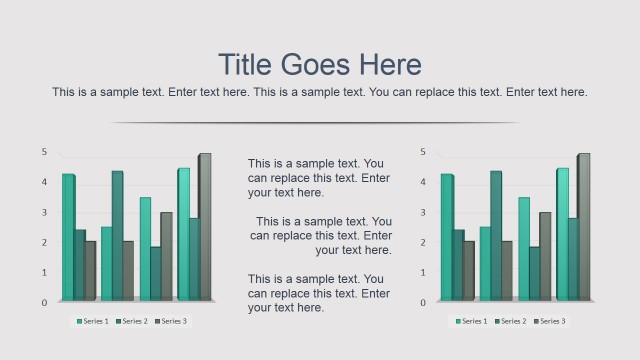
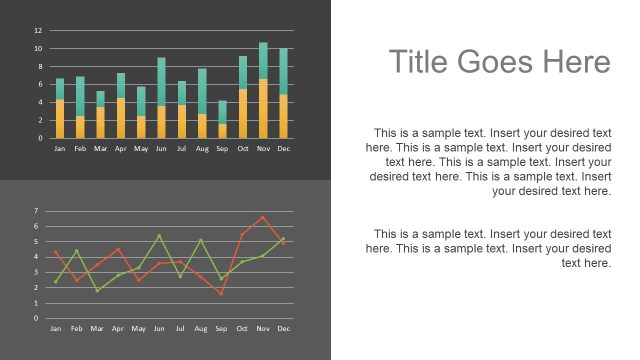
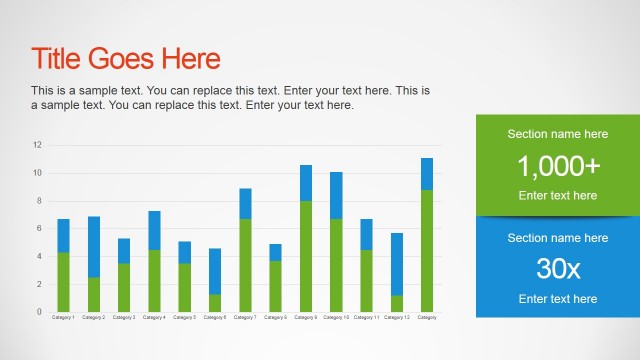
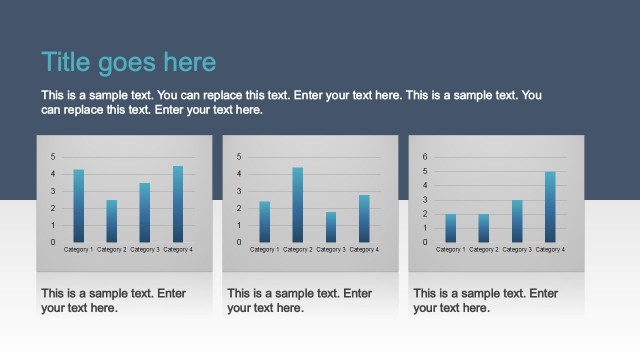
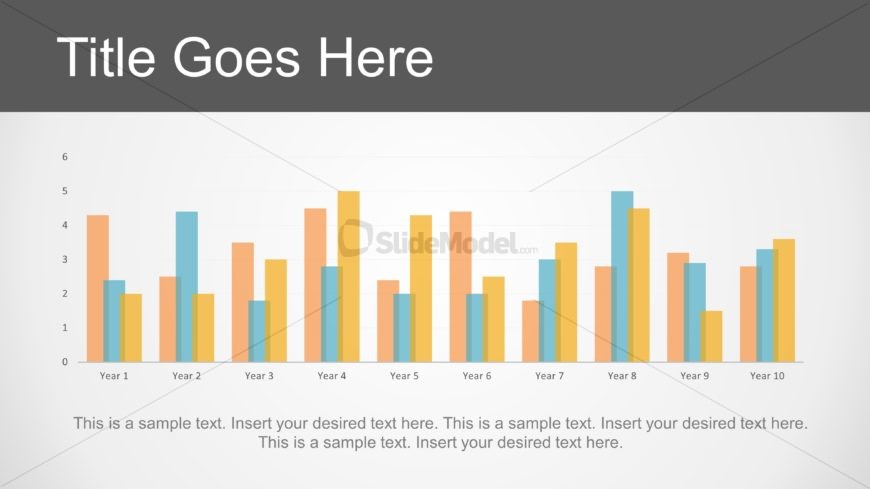
The Bar Chart with Sample Text slide from the Free Flat Business Process Diagram PowerPoint Template offers a clear and editable slide layout for visualizing annual data trends. This slide template is designed for business presentations such as sales performance reviews and project updates, featuring editable shapes and a vertical bar chart to enhance data evaluation within a corporate presentation or pitch deck template.
What’s on This Slide
The slide features a bar chart positioned centrally, displaying data across ten years. Each year is labeled at the bottom, with bars in three distinct colors: blue, orange, and yellow. The chart has a vertical axis indicating values from 0 to 6. Above the chart, there is a large title placeholder aligned to the top center. Below the chart, a text placeholder spans the width of the slide, allowing for additional descriptive content. The background is light with a gradient effect, enhancing visual clarity.
How to Use It
This layout serves as a data visualization tool, ideal for presenting performance metrics or comparisons over time. It fits well in a presentation sequence following an analysis or overview slide. This structure is useful for business scenarios such as annual reports, project updates, or sales performance reviews, where clear data representation is essential for decision-making.
Text Placeholders & Capacity
Keep your copy within these limits so it fits without resizing. Body slots can accommodate roughly 30-40 words each.
| Placeholder | Count | Max characters (approx.) |
|---|---|---|
| Slide title | 1 | 30 |
| Body paragraph | 1 | 200 |
| Item heading | 10 | 10 |
Slide Keywords
Download unlimited PowerPoint templates, charts and graphics for your presentations with our annual plan.
DOWNLOADReturn to Free Flat Business Process Diagram PowerPoint Template.