Slide 6 of 7 from Free Business Forecast PowerPoint Template
Creative Analysis Template for Forecasting
Percentage Comparison Slide for Business Forecast
- Diagram
- Comparison Split
- Evaluation Slide
- 16:9
- 100% Editable
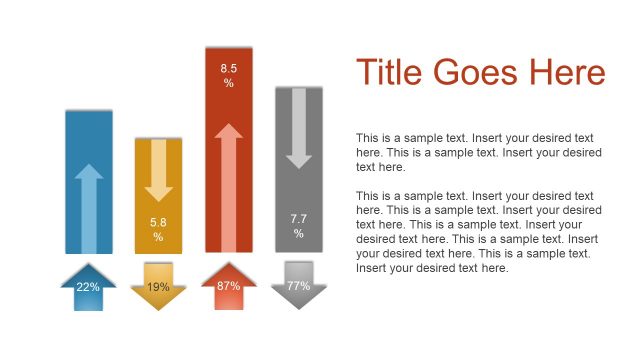
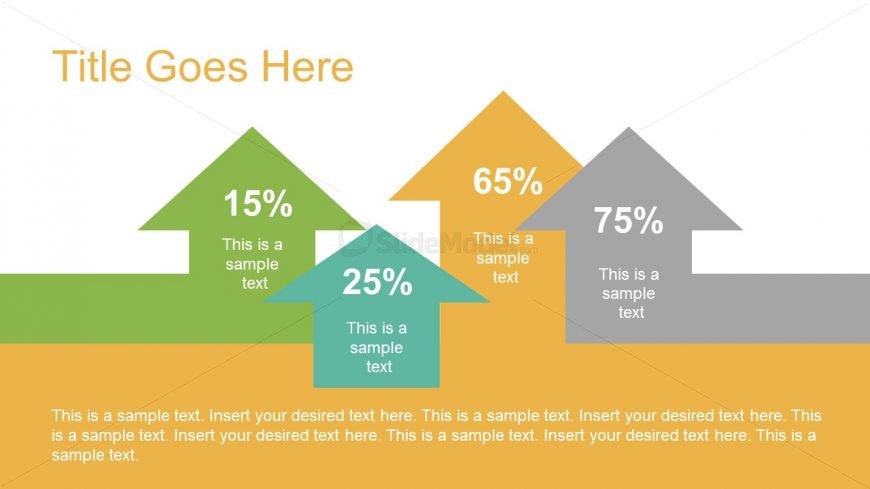
The Percentage Comparison with Arrows slide from the Free Business Forecast PowerPoint Template provides a clear visual method for evaluating market share, project progress, or performance metrics. This slide layout uses editable shapes and color-coded arrows to highlight percentage differences, making it suitable for business presentations or pitch deck templates that require concise data comparison. Its design supports effective communication of growth trends and statistical analysis within a corporate presentation or slide deck.
What’s on This Slide
The layout features three upward-pointing arrows arranged in a staggered vertical alignment. Each arrow is filled with a different color: green for 15%, teal for 25%, and gray for 75%. The arrows are labeled with percentage values prominently displayed inside them, while additional text placeholders are positioned below each arrow for descriptions. A title placeholder is centered at the top of the slide, and a wide text placeholder spans the bottom, allowing for detailed explanations. The background is divided into two horizontal sections, with the upper part in white and the lower part in a light orange hue.
How to Use It
This layout serves as a percentage comparison tool, effectively illustrating varying levels of data or performance metrics. It is suitable for business presentations that require a visual representation of growth, progress, or statistical analysis. This slide can fit into a sequence following a problem statement, leading into a roadmap or action plan. It is useful for showcasing market share, project milestones, or product performance metrics, providing a clear visual hierarchy for audience understanding.
Text Placeholders & Capacity
Keep your copy within these limits so it fits without resizing. Body slots can accommodate roughly 40-50 words each.
| Placeholder | Count | Max characters (approx.) |
|---|---|---|
| Slide title | 1 | 30 |
| Item heading | 3 | 5 |
| Item body | 3 | 30 |
| Body paragraph | 1 | 300 |
Slide Keywords
Download unlimited PowerPoint templates, charts and graphics for your presentations with our annual plan.
DOWNLOADReturn to Free Business Forecast PowerPoint Template.